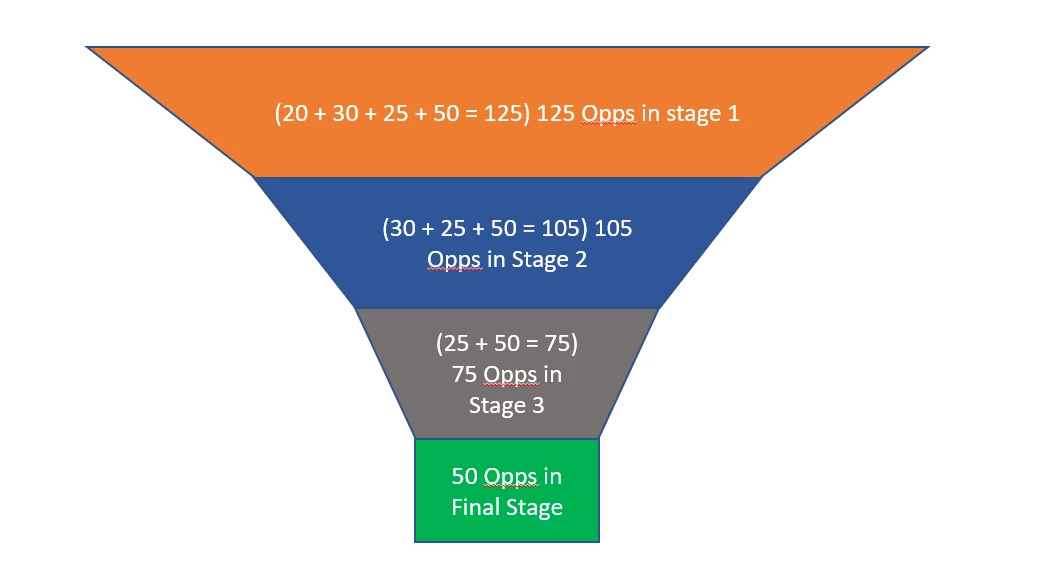
Thanks for implementing the Funnel chart in Horizon Analytics. But, still it doesn’t serve the purpose. The funnel chart must have the ability to do the cumulative calculation. What I mean is, when I build a funnel chart, I should have the ability to define the stage 1, stage 2, stage 3 and final stage. Lets say, if there are 20 Opps in Stage 1, 30 Opps in Stage 2, 25 Opps in Stage 3 and 50 Opps in Final Stage. The chart should show (20 + 30 + 25 + 50 = 125) 125 Opps in stage 1, (30 + 25 + 50 = 105) 105 Opps in Stage 2, (25 + 50 = 75) 75 Opps in Stage 3 and 50 Opps in Final Stage. By this we will be able to understand/visually see how many opps were there in each stage in a given period.