I think the User Dashboard view could use some enhancement. Currently, it shows numbers for Total Users and New Registrations with a smaller percentage for ‘previous period’ (which FYI is not clear in itself).
I’d love to have some better graphical representation of members over time, more so than just whatever the ‘previous period’ is.
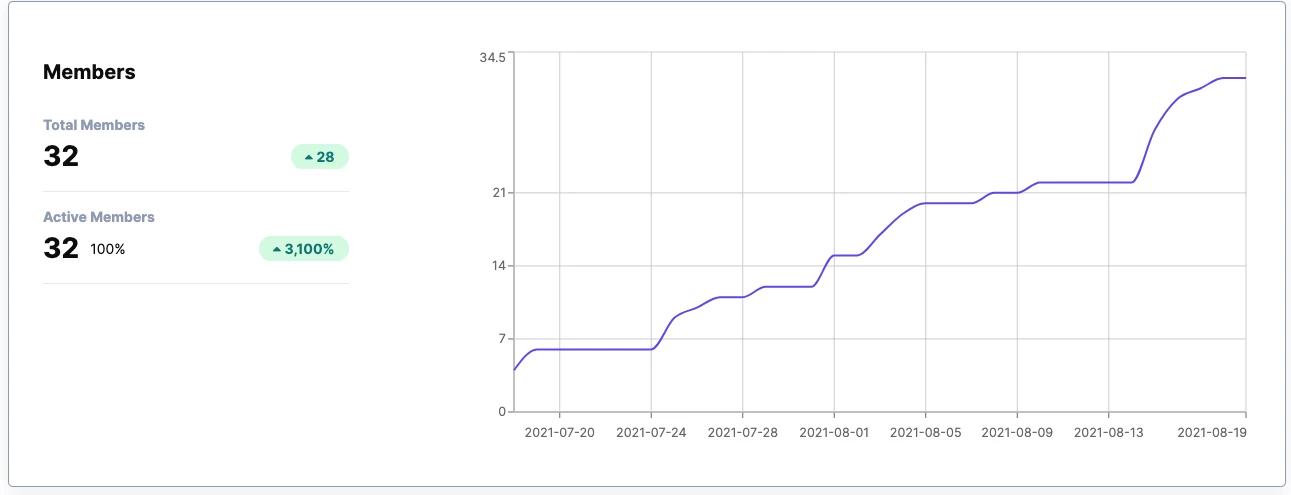
Here is an example of what Commsor shows, that I think is a great example. You can choose the date cadence, and it will show you the graph itself as well as the net difference and total members and active members.