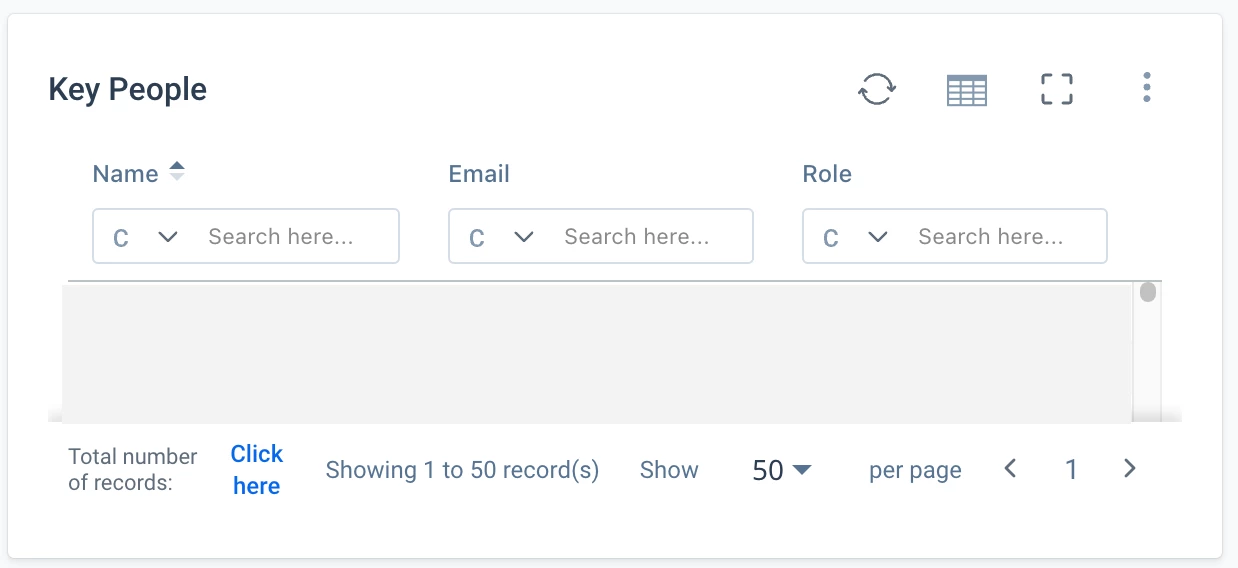
When creating a table visualization widget, the column filters row is always shown, even when you have a small dataset.
Particularly when using the Limit option in Ranking and Sorting, there are times you may want to show a small dataset of say 5 records. In these situations, it is a waste of screen space to show these filters (and the total number of records bar at the bottom with the page switcher).
It would make the use of table visualizations on dashboards and using small report widgets on the C360 Summary page a lot more flexible if we could optionally hide these visual elements where needed.