
Product Feedback Dashboard - All Ideas by Status Chart

  • August 20, 2021
  • 4 replies
  • 24 views

tiffany.oda
Forum|alt.badge.img

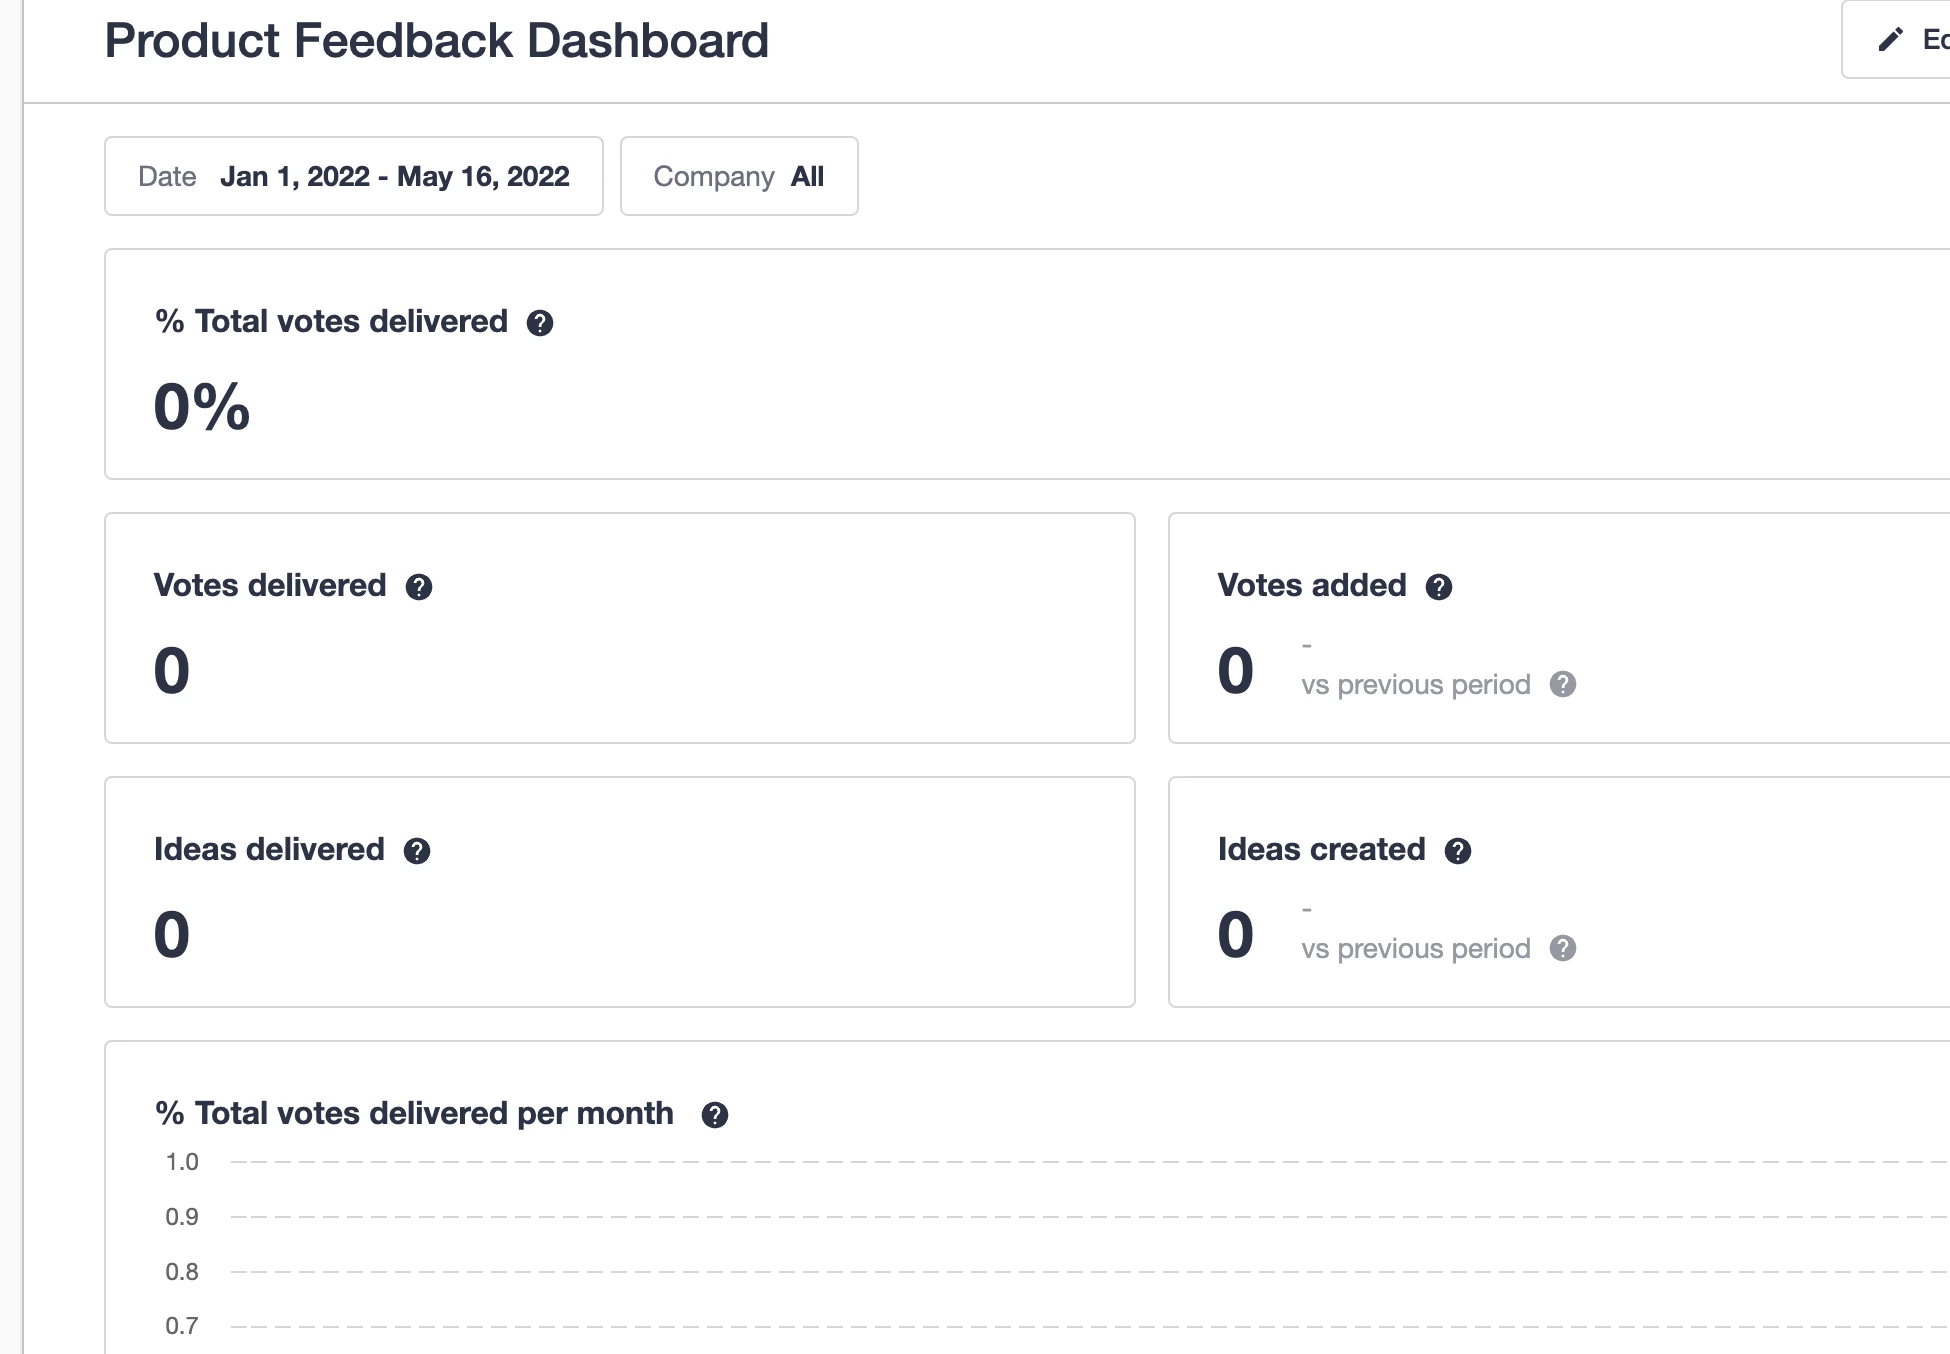
In the Product Feedback Dashboard, there is no way to see all Ideas by Status. I’d love a bar graph or a pie chart showing, for all ideas submitted, what is the breakdown of status? Even better, it would be cool to be able to filter by Product Area. 

This would provide a wholistic view of status across all ideas submitted in the community. 

4 replies

daniel.boon
Forum|alt.badge.img
  • Helper ⭐️⭐️⭐️
  • August 26, 2021

Thanks for sharing this one @tiffany.oda  - what actions would you expect yourself or your team to take based on this data?


daniel.boon
Forum|alt.badge.img
  • Helper ⭐️⭐️⭐️
  • August 26, 2021
Updated idea statusNewOpen

tiffany.oda
Forum|alt.badge.img
  • Author
  • Contributor ⭐️⭐️⭐️⭐️⭐️
  • August 26, 2021

It provides visibility to executives and the respective product teams on the range of statuses for ideas. For example, say we want to provide reporting to Product Team A on their Ideation. My initial thoughts would be to include stats like a list of newest ideas submitted, ideas with # of vote changes, any ideas with ‘upcoming’ statuses to ensure they stay on time, and the breakdown of idea by status. 

In general, a lot of the reporting and dashboards are for sharing and visibility with our stakeholders, other teams who are involved with Community activity, and also our executives and leadership. 


anirbandutta
Forum|alt.badge.img+2
  • Expert ⭐️
  • May 17, 2022

Congrats on offering the Product Feedback options team!!

@Sebastian assuming Content Overview filters is you… do you know when does the Product Feedback Dashboard starts filling out?