Greetings,
I recently came across what I believe to be an opportunity for improvements within Report Builder. I was trying to run a report of aggregate data tracking activation rates for users at a particular client over time. The goal was to see the progress of activation rate over time for our Small Market and Enterprise business segments, as well as the data Overall.
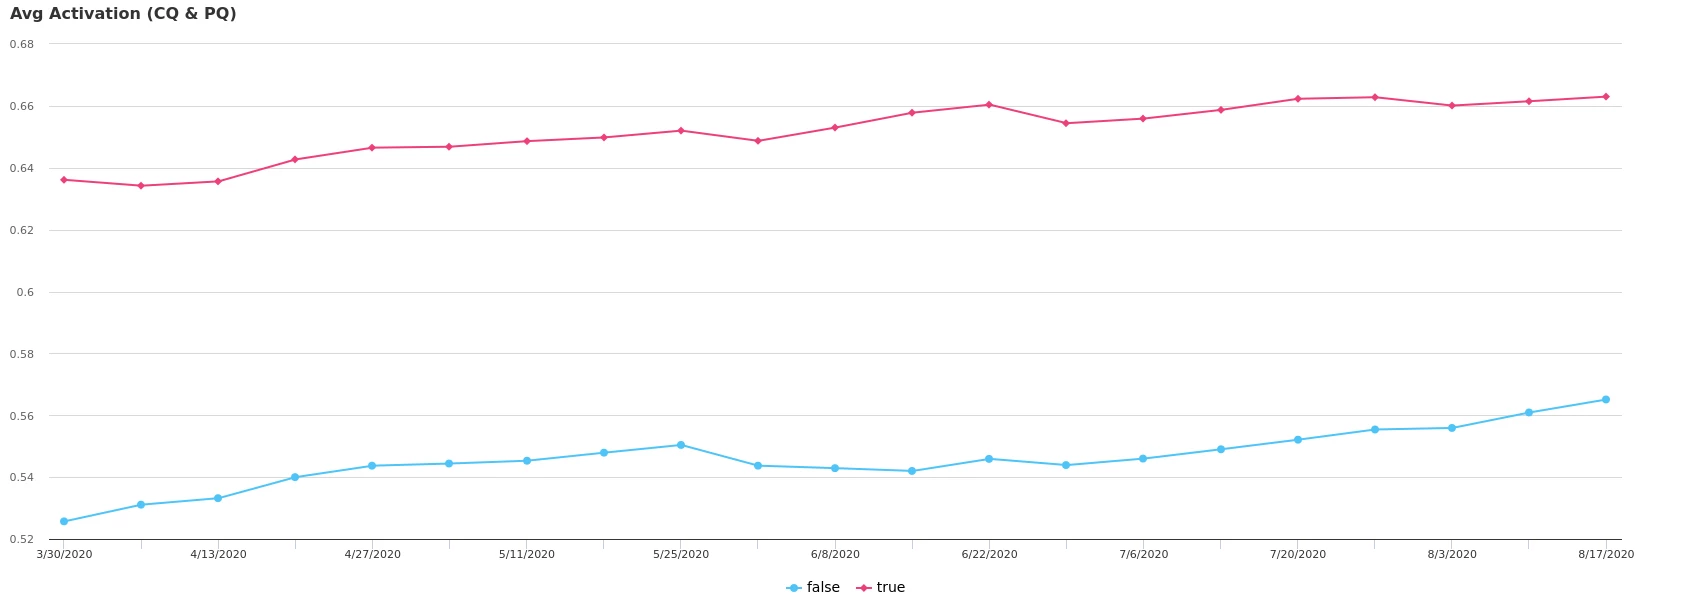
Currently, Report Builder will let me Show: Activation Rate by Small Market (boolean) [true or false]. That third trend, Overall is only available by removing Small Market from the Show By line in Report Builder.
It would be neat to be able to see the activation rate as a line graph with all three lines being tracked, Small Market, Enterprise, and Combined / Overall / both present.