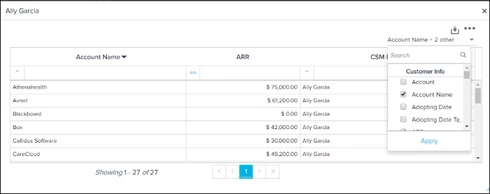
For example, our organization has an MDA data set of all the activity for a client by contact throughout the year (i.e. Demos, Webinars, Conferences, Exec Meetings). We have a client dashboard that shows activity by quarter by client. (see below)
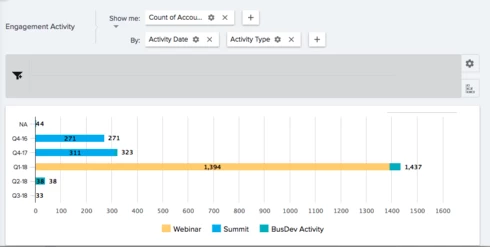
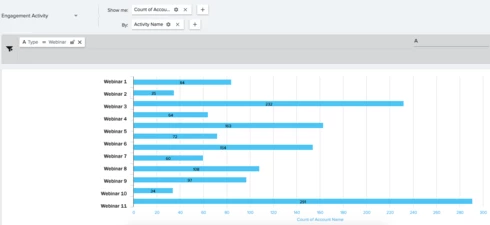
Currently we can only click on an element and drill down to detail items including the contact, activity name and date. We have built additional reports that aggregate the activity further so we can see attendance on specific items. In the screen shot below you can see a further aggregated report for webinars by webinar name. From here we can then drill into a tabular report that allows us to see which contact attended.
This functionality makes the data much more actionable and allows you to analyze and answer questions much faster. Right now we are finding ourselves having to build a lot more reports and dashboards than needed because there isn't this advanced type of drill-down capability.
Please let me know your thoughts.
Thank you.