
Reports 2.0: Need ability to create bar report with more than 3 metrics

  • September 21, 2015
  • 6 replies
  • 41 views

darkknight
Forum|alt.badge.img+5
I have multiple aggregated data points for which I need to be able to report in a bar graph.

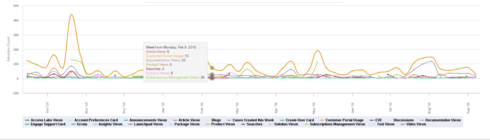
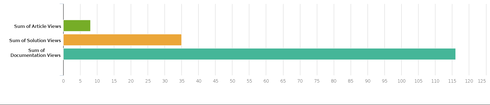
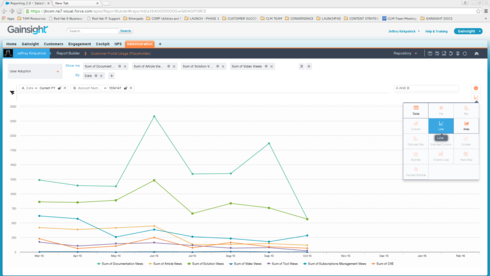
When I go to Reports 2.0, I need to be able to select at least 12 fields under Show Me, that I can display by Account Name or Number. 


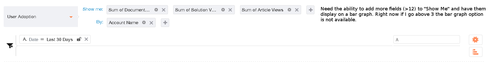
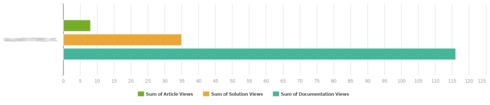
Right now I can only select up to 3 fields in order for the information to show on a bar graph.

6 replies

sumesh
  • Helper ⭐️⭐️
  • September 24, 2015
Jeff,

We've not implemented this capability because we don't have scrollbars in dashboards and report builder. As a result, we wont be able to display all fields in "show me" by account neatly without distortion.

Thanks!    

darkknight
Forum|alt.badge.img+5
  • Author
  • Expert ⭐️
  • September 24, 2015
Do you not have the ability to stack the "show me" fields the way you do on the Adoption section of C360?


darkknight
Forum|alt.badge.img+5
  • Author
  • Expert ⭐️
  • September 24, 2015
Or, to list the Show me field labels to the left of their bars?  


darkknight
Forum|alt.badge.img+5
  • Author
  • Expert ⭐️
  • October 27, 2015
This item is really important to Red Hat. I'm not sure why you're able to display a line graph when you have more than 4 items in Show Me, but not a stacked bar graph.


The line graph does not work as well in a presentation as a bar graph.  

sumesh
  • Helper ⭐️⭐️
  • October 29, 2015
Jeff, 

We will be enabling stacked bar and column chart for > 4 items in "Show me". Tentative ETA is December release.

Thanks,
Sumesh

sumesh
  • Helper ⭐️⭐️
  • December 19, 2015
Jeff,

This feature will be available in Jan release.

Thanks!