
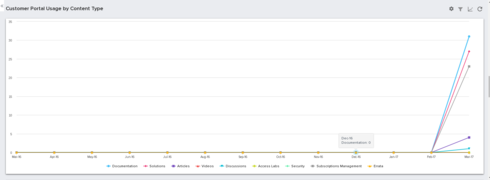
It would be incredibly helpful to have this dynamically adapt to the time period in the filter. So in the case above which is filtering on Current FY, it would only show data since January 2017 and eliminate all the empty months leading up to it.
If there is already a way to do this, I would love to know. Thanks!