If you’re just now tuning in, please check out my FAQ post as well as my Getting Started post regarding the CC+CS integration.
Now that you have the CC+CS integration enabled and are familiar with how to build reports using the data, you may be wondering what reports we recommend creating.
There are many ways you can use CC data in CS, ranging from the quick to implement to the more complex.
Starting use cases (Reporting):
- Out of the box widget on C360
- Custom “Community” tab on C360
- Dashboards with visualizations and reports
Advanced use cases (Actions):
- Community health score as a component of a Company’s health score
- Triggering CTAs based on a drop/absence of Community activity
- Using Community data in Journey Orchestrator programs
In this article I’m going to focus on the reporting use cases.
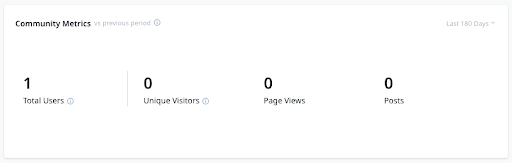
C360 Widget
This can be added to the Summary page of the C360. It contains a few key numbers and allows the user to adjust the time period it is displaying for.
Custom “Community” tab on C360
You can add a tab to the C360 to house that Company’s CC data. Recommended reports for this section include:
- Community Posts
- Community Users
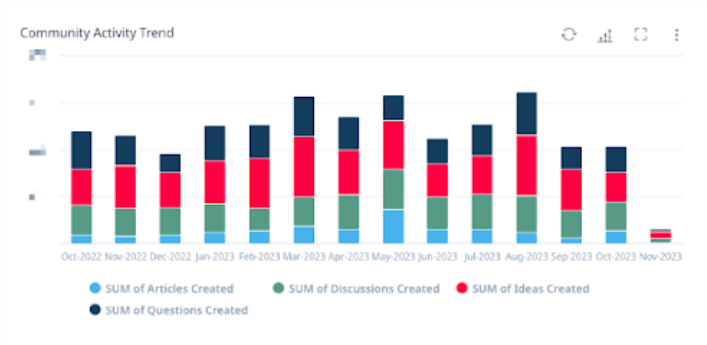
- Community Trend
This can be helpful for a CSM to review prior to joining a call with the client. There may be a recent post they want to discuss, or they might want to note that a new member joined the Community.
Dashboards
I recommend creating different dashboards for the different personas who will be consuming this data in CS. The three I discuss below are a Community Manager, a CSM, and an Executive. You could also create a dashboard for a Product Manager, or add CC reports into an existing Product Manager dashboard.
For each of these dashboards, I asked myself these questions:
- What questions am I looking to answer?
- What actions do I want to drive?
Tip: To best view the dashboard screenshots, you can right click on each image and select “Open Image in New Tab” in order to zoom in and view the details.
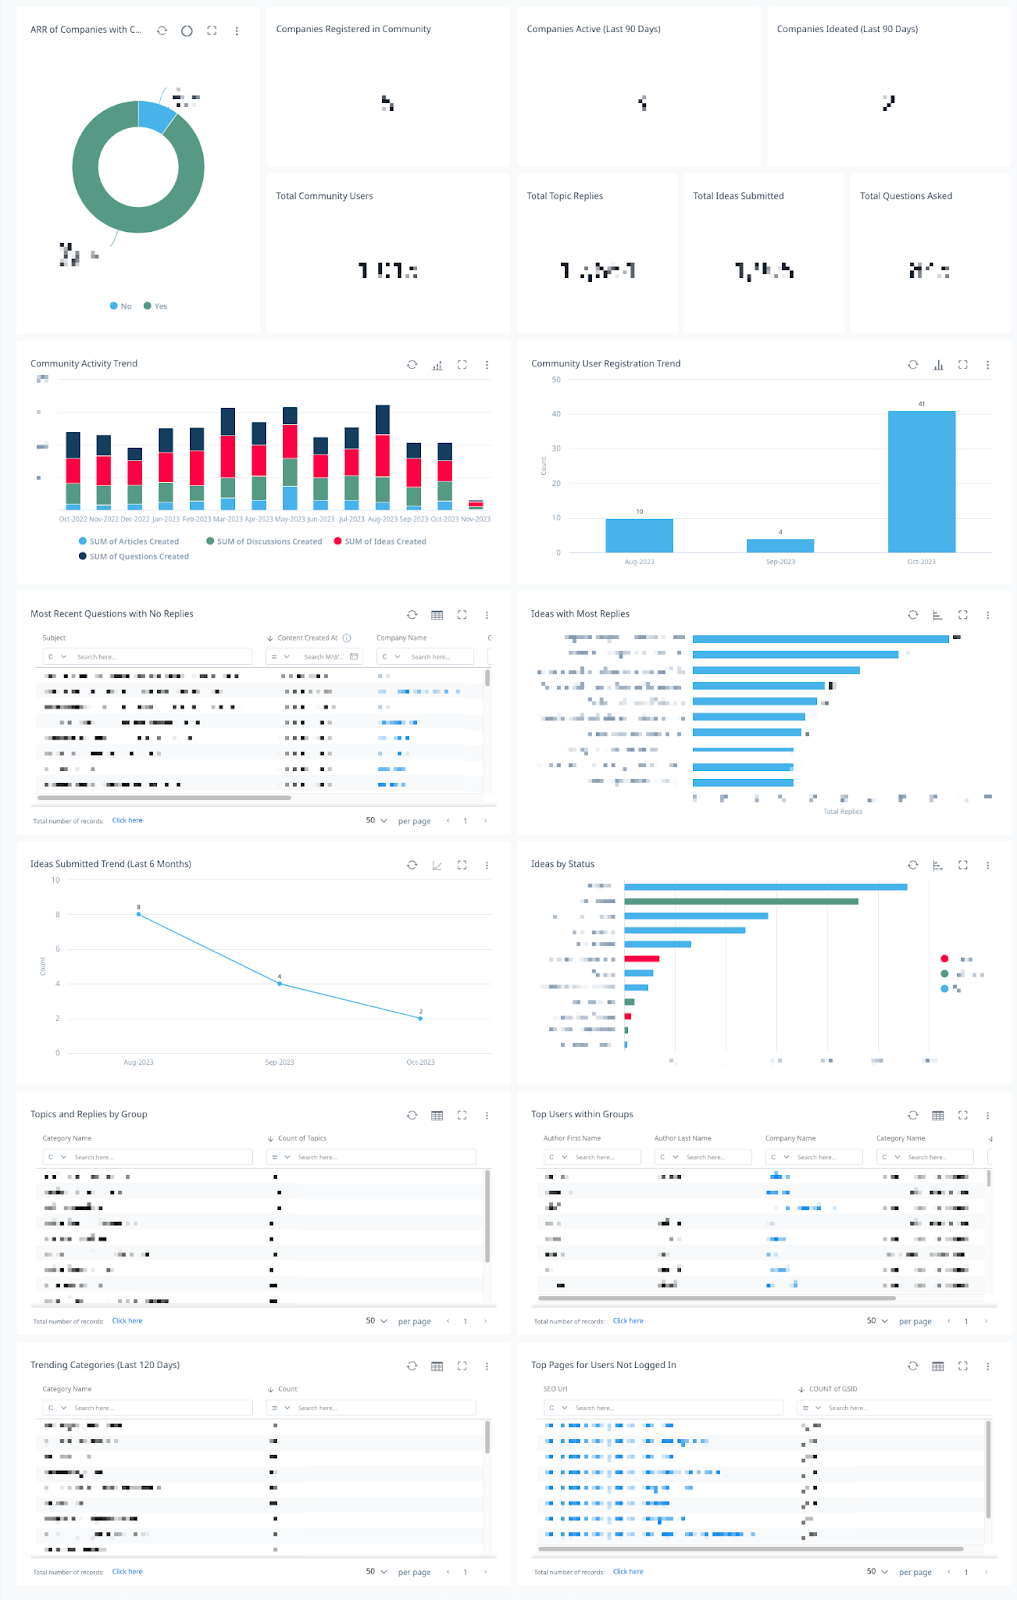
Community Manager
This dashboard helps a Community Manager see what areas are succeeding, what areas may need work, and trends across the community.
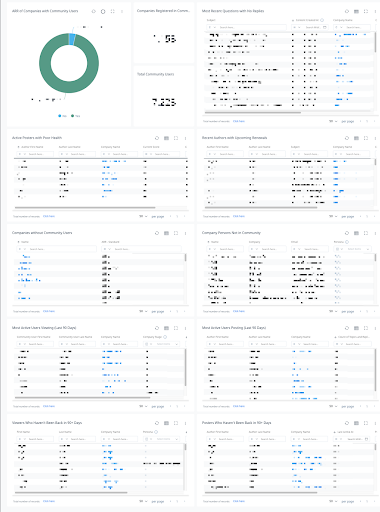
CSM
This dashboard helps a CSM monitor community activity across their book of business. It also helps surface which Companies and Contacts aren’t active in the community and might benefit from outreach.
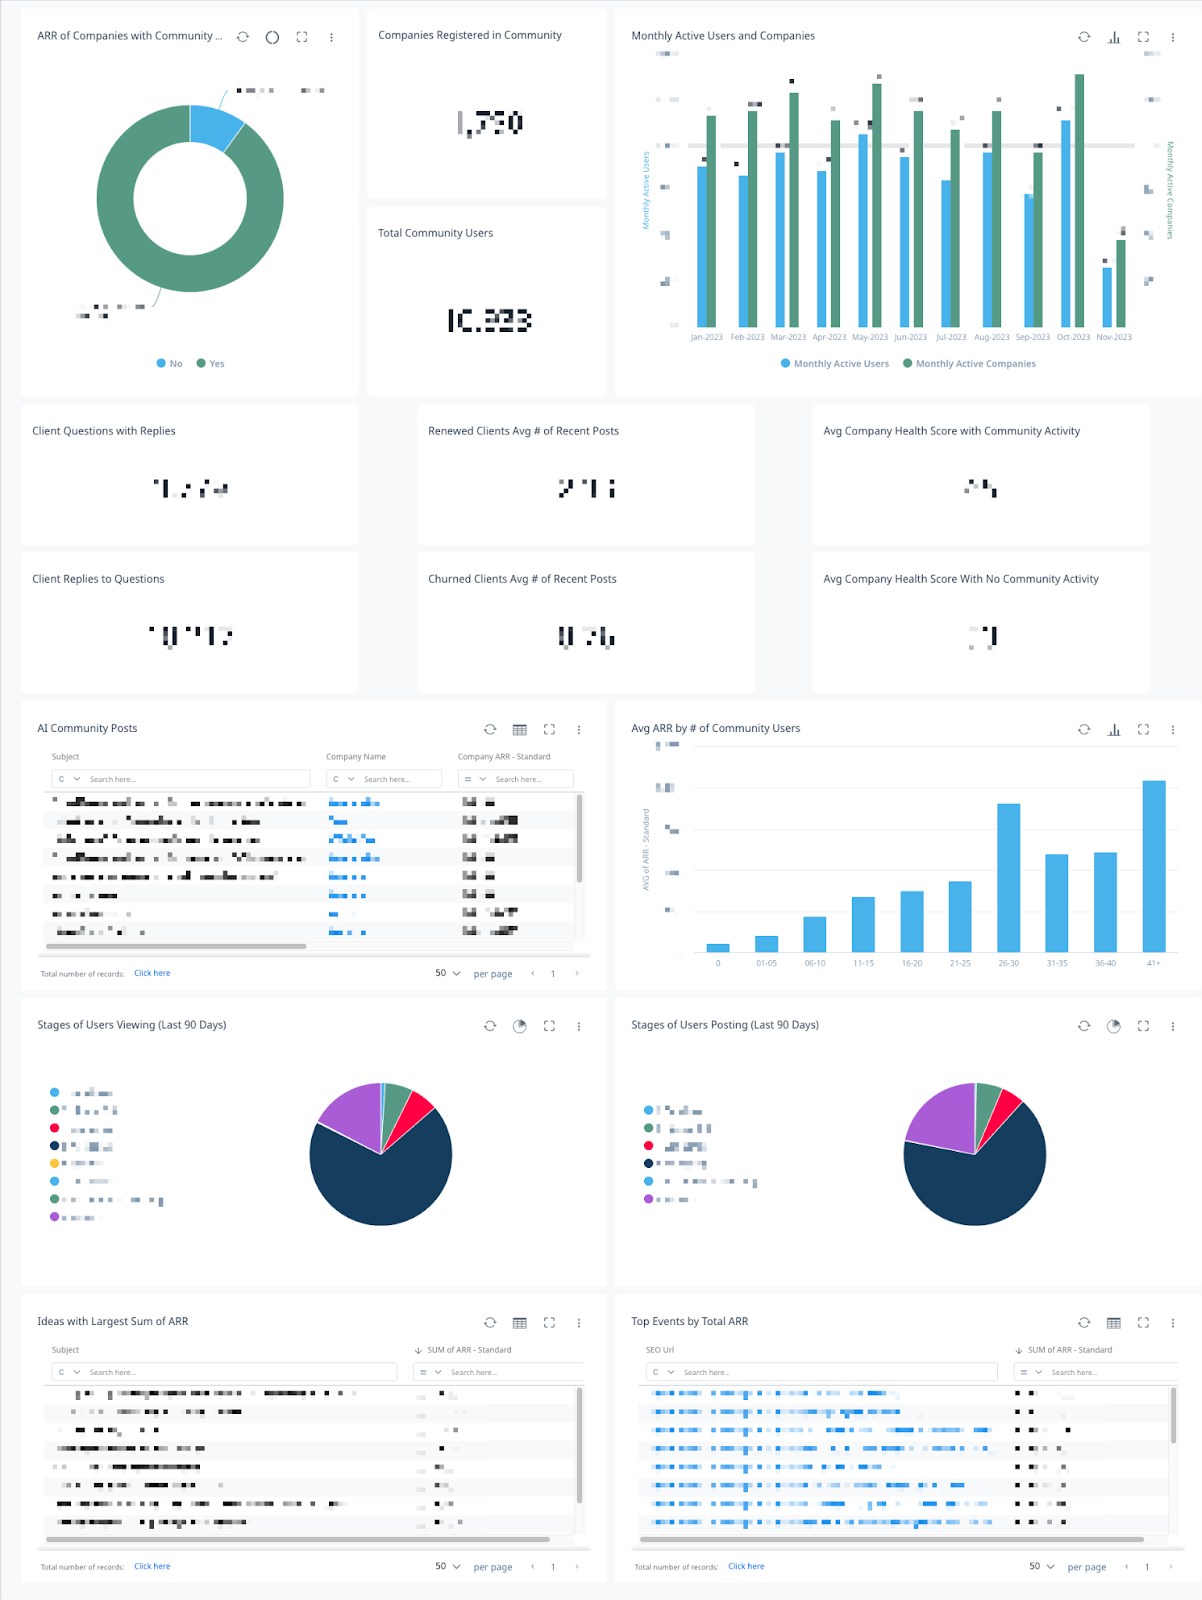
Executive
This dashboard helps an executive connect community activity to ARR, healthscores, and retention, as well as see the impact the community has on departments across the organization. For example, questions being answered in the community might be reducing Support ticket volume, and Prospect clients interacting in the community might be impacting Sales.
I hope this has given you something to think about wherever you’re at with your CC+CS integration. Is there anything else you’d like to see in a future article?