
CC Dashboards - Feedback Needed!

  • February 11, 2025
  • 13 replies
  • 139 views

sshroff
Forum|alt.badge.img+5
  • Gainsight Employee ⭐️⭐️

Hello Beta Testers, 

As part of our closed beta group, your insights and experiences are crucial in refining new dashboards to better serve your needs. 

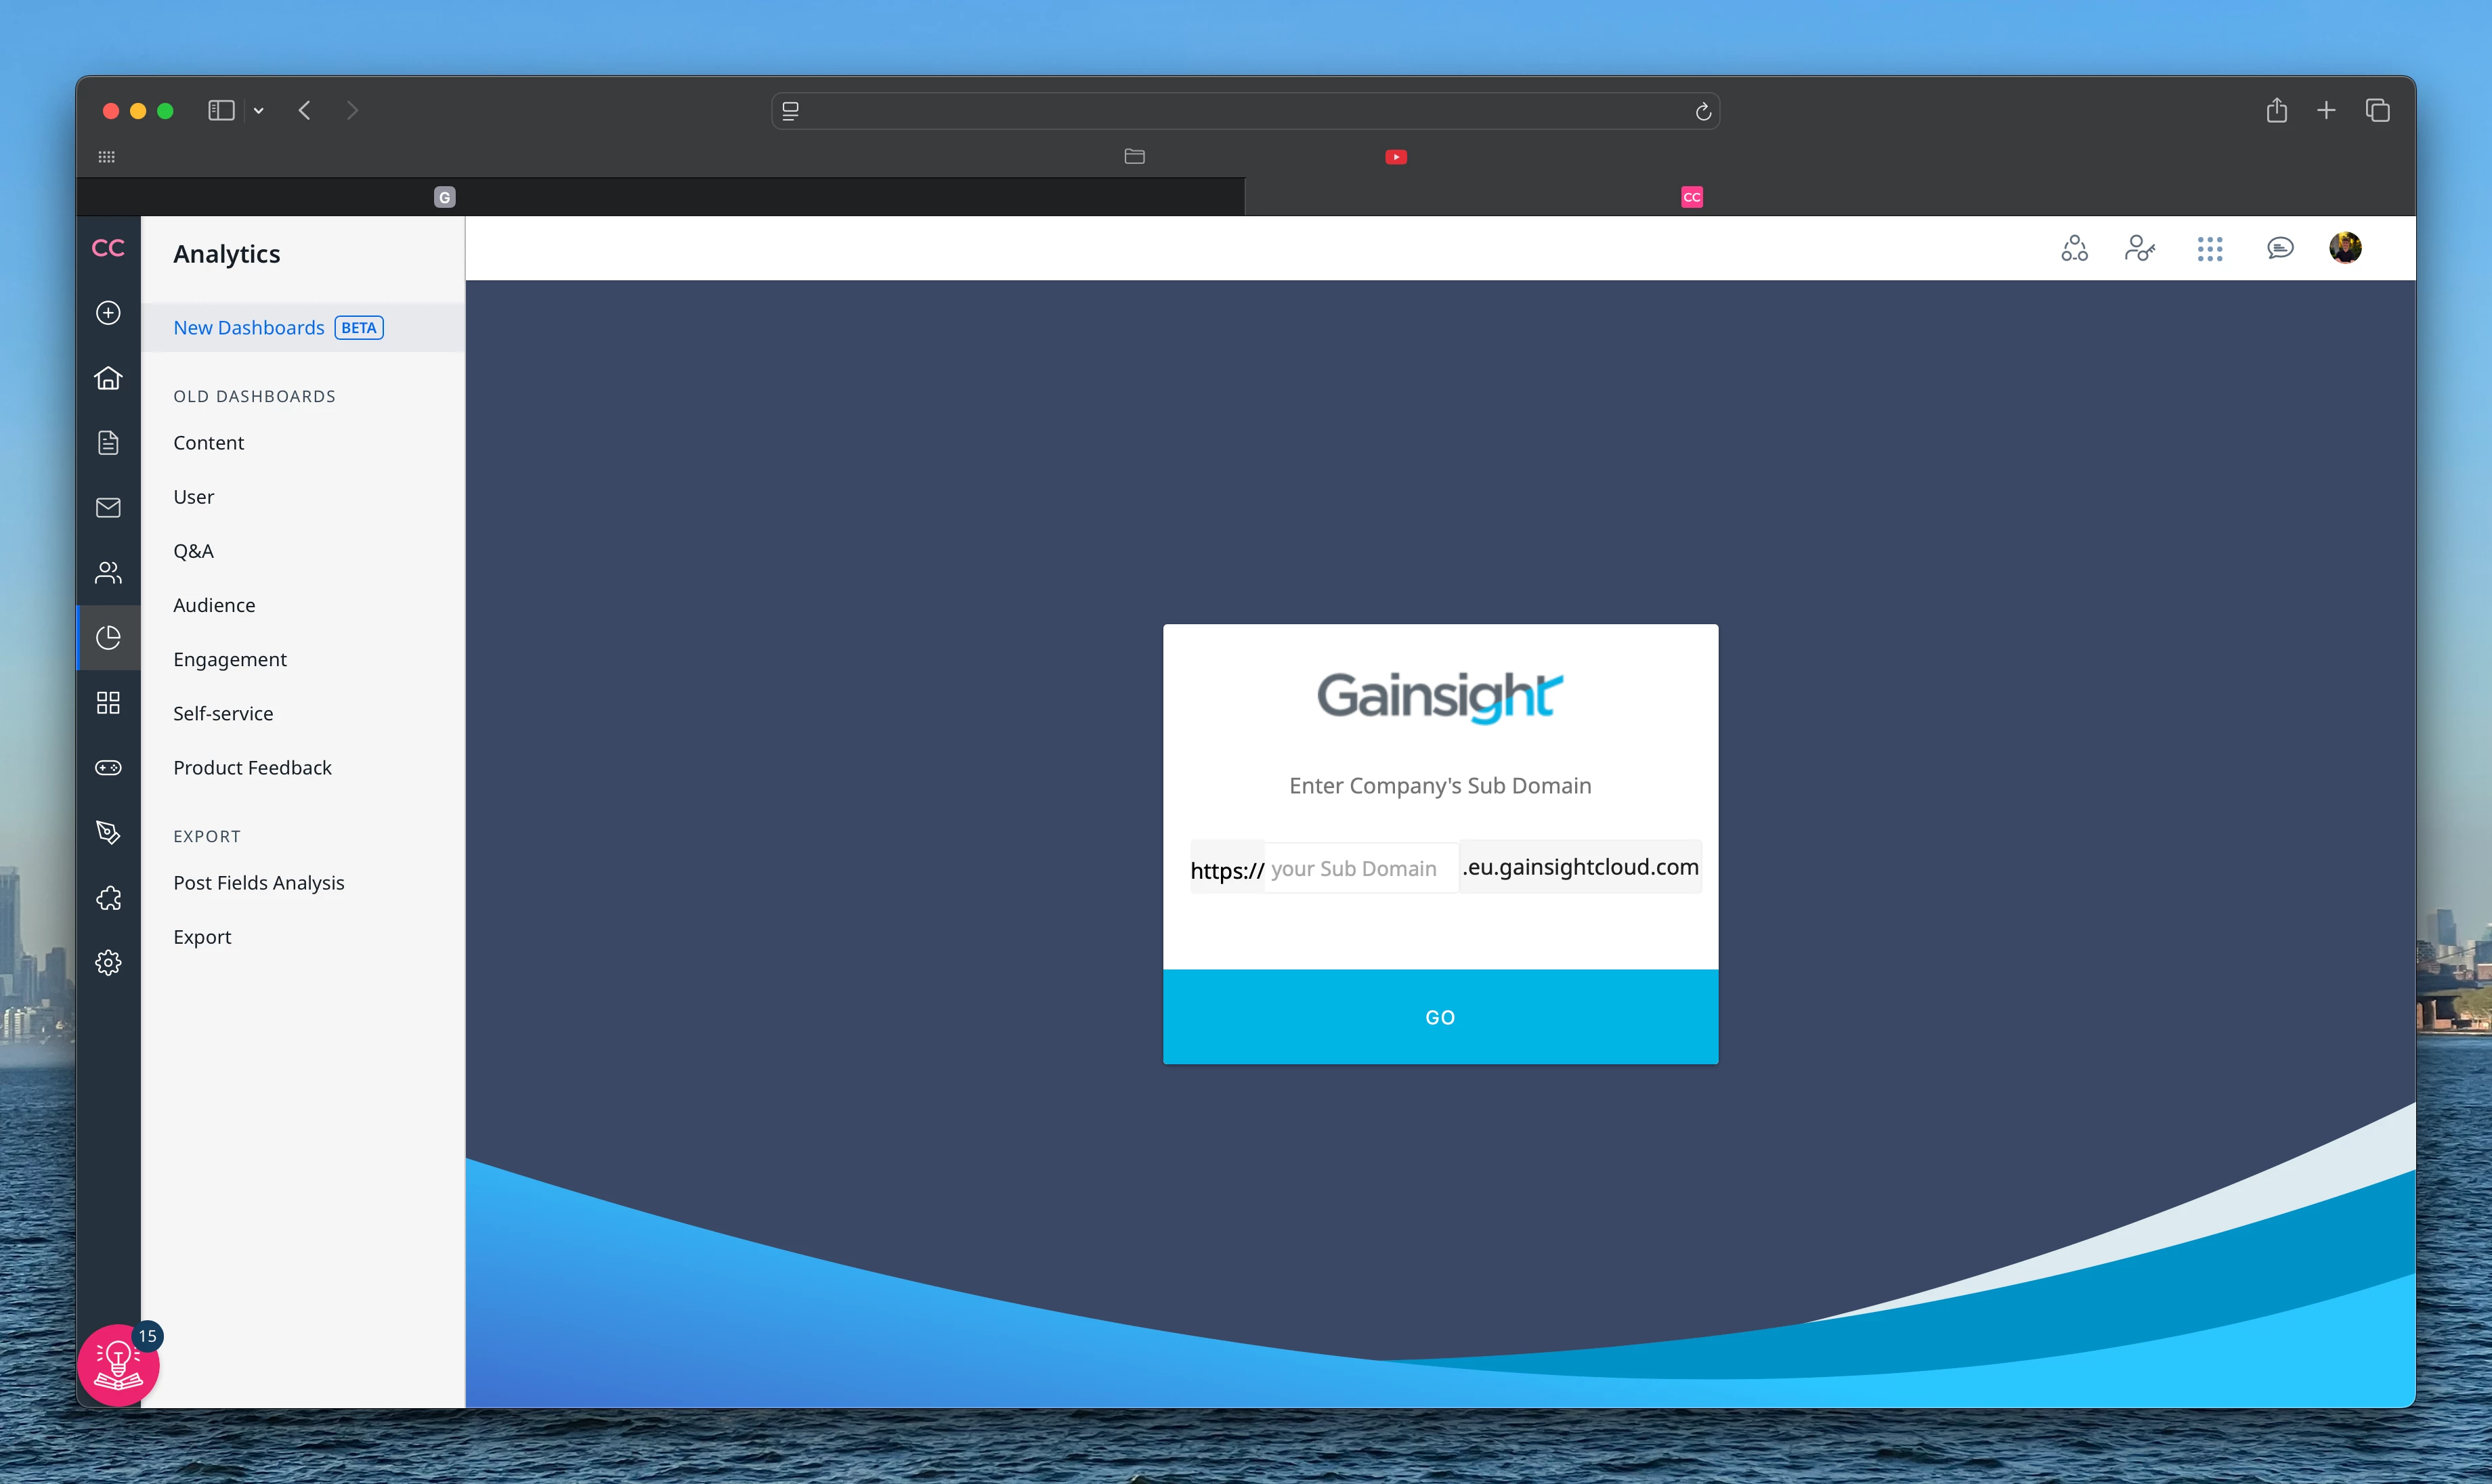
While the KPIs remain the same in New and Old Dashboards, the new dashboards offer enhanced user experience and additional functionalities designed to make data analysis more intuitive and efficient. 

We would love to hear about your engagement with these new features and your overall impression of the New dashboards.

Here are some important areas where we seek your insights:

  • Ease of Use: How easy do you find it to navigate the new dashboards? Are there specific areas where you struggle?
  • Feature Usage: Which new dashboard features do you use most frequently? Are these features meeting your needs, and how do they enhance your overall experience with the tool?
  • User Experience: How would you describe the navigation and usability of the new dashboards compared to the old version? Do you find it easier or more challenging to access the information you need?
  • Data Visualization: What are your thoughts on the visual design of the new dashboards? Are there particular visual elements that you find helpful or distracting?
  • Performance: Have you experienced any changes in loading speed or overall performance when using the new dashboards? How does it compare to your experience with the previous version?
  • Customization: How satisfied are you with the extent of customization available in the new dashboards? Are you using them?
  • Resources and documentation: Did you find the resources/documentation provided for the new dashboards helpful? Is there additional support or training you feel would enhance your experience?
  • Value Perception: Overall, do you perceive the new dashboards as an upgrade from the old version, or do you feel they offer no additional value?
  • Overall Sentiment: In your opinion, does the new dashboard improve your workflow regarding data analysis? Would you recommend it to others within the community based on your experiences thus far?

We encourage you to provide your thoughts by replying to this post. Your feedback is vital in guiding our future developments and ensuring that we provide the best possible tools for your needs.

Once we’ve gathered feedback, we will be scheduling a roundtable in the coming weeks to discuss further and answer any questions you may have.

Thank you for being a crucial part of this beta testing phase—we look forward to your insights!

13 replies

Aleksandra
  • Gainsight Product Manager
  • February 12, 2025

@DannyPancratz , ​@Ditte , ​@Ilona, ​@jillian.bejtlich , ​@Grzegorz Byrski , ​@Matthew Thompson , ​@Sahra I would appreciate your feedback. 


Matthew Thompson
Forum|alt.badge.img+1
  • Contributor ⭐️⭐️⭐️
  • February 12, 2025

Hey ​@sshroff, ​@Aleksandra,

Unfortunately, I've been unable to utilize the New Dashboards, as they don’t support Safari with the default Privacy & Security settings.


I did have a play around using Microsoft Edge when the Dashboards first launched, but as this is not my preferred browser, couldn’t provide much input. Hopefully this can be fixed soon!

Thanks.


Aleksandra
  • Gainsight Product Manager
  • February 13, 2025

@Matthew Thompson Thank you for this feedback. Our team is working on necessary changes, so that Safari users can also access new dashboards. 


Sahra
Forum|alt.badge.img+1
  • Contributor ⭐️⭐️
  • February 17, 2025

Hi ​@Aleksandra & Team, Please see my feedback below, hope this helps
 

  • Ease of Use: How easy do you find it to navigate the new dashboards? Are there specific areas where you struggle?
    1. It's quite simple to use once you get use to where everything is and apply the filters correctly. 
  • Feature Usage: Which new dashboard features do you use most frequently? Are these features meeting your needs, and how do they enhance your overall experience with the tool? 
    1. I use the user and audience overview dashboard most frequently. 
    2. The enhanced visualisations have been a game changer and has enhanced and improved internal reporting a lot.  
  • User Experience: How would you describe the navigation and usability of the new dashboards compared to the old version? Do you find it easier or more challenging to access the information you need?
    1. It's a learning curve. The old dashboard is much more simpler and easier to navigate however does not have as much features as the new dashboard.
    2. Once you've configured the filters and understand how to navigate through the new dashboard, it is quite insightful
    3. What both dashboards are lacking as may be an overview or an insight with AI or just highlights of what has happened here are the key trends or insights in your community. Something similar to the front page Gemini recap that would be great to have in the reporting as well.
  • Data Visualization: What are your thoughts on the visual design of the new dashboards? Are there particular visual elements that you find helpful or distracting?
    1. The new visualisation is are a great way to visualise your data in a different way and get more insights. I found the different options quite helpful.
  • Performance: Have you experienced any changes in loading speed or overall performance when using the new dashboards? How does it compare to your experience with the previous version?
    1. The new dashboard loads quite slowly compared to the other dashboard. 
    2. I'm not always able to access it. I might have to reset the browser or try and access through incognito window which works better.
  • Customization: How satisfied are you with the extent of customization available in the new dashboards? Are you using them?
    1. There are a lot of features that I haven't had a chance to try yet, but I like the capability of advanced filtering. To filter out certain dates to get a more accurate understanding of the data.
  • Resources and documentation: Did you find the resources/documentation provided for the new dashboards helpful? Is there additional support or training you feel would enhance your experience?
    1. The resources and documentation were very helpful and helped understanding certain aspects. I may have missed or more possibilities that I could use the dashboard for.
  • Value Perception: Overall, do you perceive the new dashboards as an upgrade from the old version, or do you feel they offer no additional value? 
    1. Yes, the new dashboard is a definite upgrade from the old version and cannot wait for the full release.
  • Overall Sentiment: In your opinion, does the new dashboard improve your workflow regarding data analysis? Would you recommend it to others within the community based on your experiences thus far?
    1. Yes, the new dashboard does improve my overall workflow in my data analysis and I would recommend it to others to use

Additional feedback:
 

It would be important and great to have more analysis capabilities for events and custom pages. I now have to go to multiple different channels or use GA4 or something else to get the data. Simple data I like who has registered from where those kind of information needs to be exported. Also general user information where our majority of our community members located for example for us to understand the localisation side of things to help improve on that. 

More details on users for example if I click on a registered user just understand what kind of a user profile they have and what posts they've done or liked or what they voted for. That will also help our product team understand.


Aleksandra
  • Gainsight Product Manager
  • February 17, 2025

Thank you ​@Sahra for you feedback 


DannyPancratz
Forum|alt.badge.img+9
  • VIP ⭐️⭐️⭐️⭐️⭐️
  • February 18, 2025

I’ve just now been able to take a look at this.

In general, Sahra’s feedback is spot on. I +1 pretty much all of that. 


Some additional thoughts: 

  • Resources and documentation:
    • This is the best I’ve seen in a beta (or even in generally available features) and it is MUCH appreciated and very helpful.
    • One gap would be in a way to define all the many options available when customizing metrics with filters. (Not necessarily the logic, but the fields themselves)
      Example; it’s not clear what these are


      • That said, there are a ton of options here, so that could be quite the undertaking
    • When you get to GA, I would recommend supplementing with some short tutorial videos and examples. There’s so much power here, but much of it comes in the complexity of customization. That could be a blocker to value realization. 
      • But doing some short videos that answer past questions in the community / or to CSMs or support, would be a good way to highlight some example use cases. 
      • For example: Here’s how to use the Audience dashboard to get a view of 
        • A single user’s activity
        • A single company’s activity 
  • Value Perception / Sentiment
    • Overall, this seems quite powerful and a major step forward. I’m excited to explore more as use cases pop up. 
    • That said, my comment about documentation and resources is a key opportunity for making this a difference maker at GA: this is an area where greater enablement (beyond thorough documentation) could really pay off in terms of adoption, value perception, and sentiment. Otherwise, the complexity could cause the opposite. It could be intimidating for some or some of the use-case-based value might be hidden in filters that some don’t try / know about. 

I know you’re asking for feedback on what’s there, but here are some thoughts on what’s missing: 

  1. Users dashboard: see the underlying users in many of the metrics
    1. Answer the question of “who?” on those summary metrics
    2. Similar to how you can see the “who” of email campaign metrics
    3. “Download Data” option on these metrics had me hoping I could download the underlying data, but instead it’s just the exact data shown in the chart. 
  2. Anything that can be viewed as a table, should have the corresponding Id added in as a column (topicId, userId, categoryId, etc)
    1. For example, the Popular Topics and Popular Categories visualaiztions that can be viewed as tables
      1. The export option is fantastic here, but matching it up to other exports and reporting will be a pain without the corresponding Id. 
      2. For example, if topicId was part of it, you could do a vlookup and pull in other metadata on that topic (tags, moderator tags, etc) 
        1. That said, Topic-based filters currently missing (public tags, moderator tags, others) would allow you to do this in the dashboard filtering tool 
  3. (Long term roadmap for this) Favorite an individual metric (and pin that to Control Home summary)
  4. Filter by segments
    1. custom roles is a current work around-ish (requires manual bulk action to add the role to those in the segment)
    2. I think you’ll see users wondering why they can create a segment, but can’t leverage that segment as they filter and explore these dashboards
  5. Median time to reply/median time to answer for Q&A dashboard

Aleksandra
  • Gainsight Product Manager
  • February 19, 2025

Thank you ​@DannyPancratz for sharing your feedback and ideas for improvements. 


jillian.bejtlich
Forum|alt.badge.img+2

I just wrote out a giant thing of feedback, hit ‘Send’, and got a ‘Something has gone wrong’ banner of doom sending the entire post into a void. Sigh. Let’s try this again (but briefer since I’m shorter on time).

Very much agree with everything Sahra and Danny shared.

  • Audience
    • Need option to export total views/visitors per day, not broken out by guest vs. registered. Having to import this into another tool to sum the days is an unnecessary step for us. Would also prefer to be able to view visualization as total as well.
  • Content
    • Need to include URL in export. Was surprised to not see that there. Preferably include at least public facing URL; including control URL would be helpful too for internal work such as content audits.
    • Idea data is still very trapped. Need the ability to see and export which users are upvoting which ideas.
    • Would really like to see us include navigational pages in page views and visitors. I’m surprised we’re still unable to access that data as it helps us understand where to spend resources, effectiveness of landing pages, etc.
  • Q+A
    • No feedback. We rarely use this dataset.
  • General
    • Definitely need to add in the Users dataset. We utilize this data extensively right now and I’d hate to see it go.
    • Need the ability to set filters and save as an additional view. We have multiple reports we pull from the same data set (ie, content generated by employees, content generated by customers) and not having to reset filters constantly would be wonderful.
    • Would very much recommend some tool tips for first time users of this functionality. It’s intuitive for someone who has used Gainsight CS’s data tools or really any advanced data tool, but I could see a lot of CMs getting lost and overwhelmed in here.
    • Very much agree with Danny that more data should be included in exports such as Topic ID, Category ID, User ID, etc. This allows us to merge data in ways that are outside the scope of these dashboards.
    • Running into some issues with access. I can get in without issue right after logging into community. If I remain active in community, but don’t access the data section for awhile I’m running into an issue logging in and access the dashboards. I’ve repeated it many times!
  • Wishlist
    • If you set the date range to ‘month’, it’s feasible to extract M/M growth. I’d like to see the option to include Y/Y growth if possible. M/M is too subject to seasonal changes (ie, December is slow and makes January look wildly successful).
    • Would prefer to have all the filters from Content Overview available in these dashboards too, especially things like Author, last activity date, moderation labels, etc. For example, we need to be able to pull reports on things we have identified as product feedback.
    • Would really like to be able to access referral data instead of having to leverage Google Analytics. We need to know where people are coming from and if they move around community.

Thanks!


Aleksandra
  • Gainsight Product Manager
  • February 20, 2025

Thank you ​@jillian.bejtlich for sharing and I’m sorry you lost the first version. All the more thanks for the extensive feedback.


  • Contributor ⭐️⭐️⭐️
  • December 10, 2025

Overall, I like the new dashboards. The filters are a little hard to see and it takes some getting used to.
One thing I am struggling with and hoped the new dashboards would address, is a quick look at the overall helpfulness score for content. You have a Positive Content Helpfulness Votes at a glance but that number does not tell me much. We have KPIs we try to meet with article CSAT and I have to do a lot of exporting the data, auditing the data to ignore articles with no ratings at all, and then average all the ratings we have.
I would expect to be able to see an overall average helpfulness score that would adjust as you filter it. So, I could see the helpfulness score of product updates vs articles, or for specific category of articles. And I agree with Danny on having an ID available. We have 17+ products and several articles with the same/similar names, it can be hard to know which article the rating is from. 

I think someone else mentioned it but in the total boxes on top, they have the option to Download Data which you assume would drill-in to what went into getting that number. But it just exports a spreadsheet that is just that single number. It hinders the visibility needed when dealing with and dissecting metrics.  

Would love the option of saving multiple set-ups on the dashboard. For example, I can favorite Content as a dashboard but it would be great to save or bookmark a version that is sorted and filtered a specific way for different needs. For example, Content for Last Month set to just certain categories, and another for Content for Last Quarter set to only articles with a helpfulness score, etc. 


Aleksandra
  • Gainsight Product Manager
  • December 11, 2025

@Liz K Thank you so much for taking the time to share your feedback with us. Your insights are incredibly valuable and help us understand what’s working well and what could be improved. We'll definitely review your suggestions, and add to our roadmap for improvements. Could you please elaborate more on the overall helpfulness score for content? We currently provide helpfulness votes for each topic (and have enabled them for exports), and you say it is not enough. I'd like to better understand how you envision the overall scores working.


  • Contributor ⭐️⭐️⭐️
  • December 11, 2025

Absolutely! We have overall goals for article CSAT. We use a 1-3-5 rating everywhere else in education so we are converting the percentage into a number. In ZenDesk and Salesforce we were able to see the total average score across all articles, and then breakdown by product as well. 
The reporting shows a Helpfulness score of 0% if an article only received 1 unhelpful rating. But it also shows a score of 0% for any article that has no ratings at all. This is making it difficult for us as we have to do an export of all the data and then adjust and filter it to remove articles that have no ratings, since they don’t truly have any data. 

I would be happy to chat on a call as well, or provide more details if you like. 


Aleksandra
  • Gainsight Product Manager
  • December 12, 2025

Thank you so much for sharing these additional details! It's a great idea to meet closer to the date when we can actively work on this, sometime in Q1. Let's keep in touch and schedule a time closer to then.