
This article guides community managers and administrators on using customization options available on New Dashboards in their community.
Overview
New Dashboards bring advanced reporting capabilities to community analytics. These reporting capabilities make the dashboard interactive and customizable with features such as global and individual filters, report visualization options, data exports, and more. Community managers and administrators can use these dashboards to keep a check on their community’s pulse using a range of Key Performance Indicators (KPI) widgets and reports. In addition to the out-of-the-box configured dashboards, they can customize each widget and report as per their business needs.
Prerequisites
- The community tenant must have the Gainsight Single Sign-On (SSO) enabled.
- The browser cookies must be enabled. The cookie settings for the most widely used website browsers are listed below.
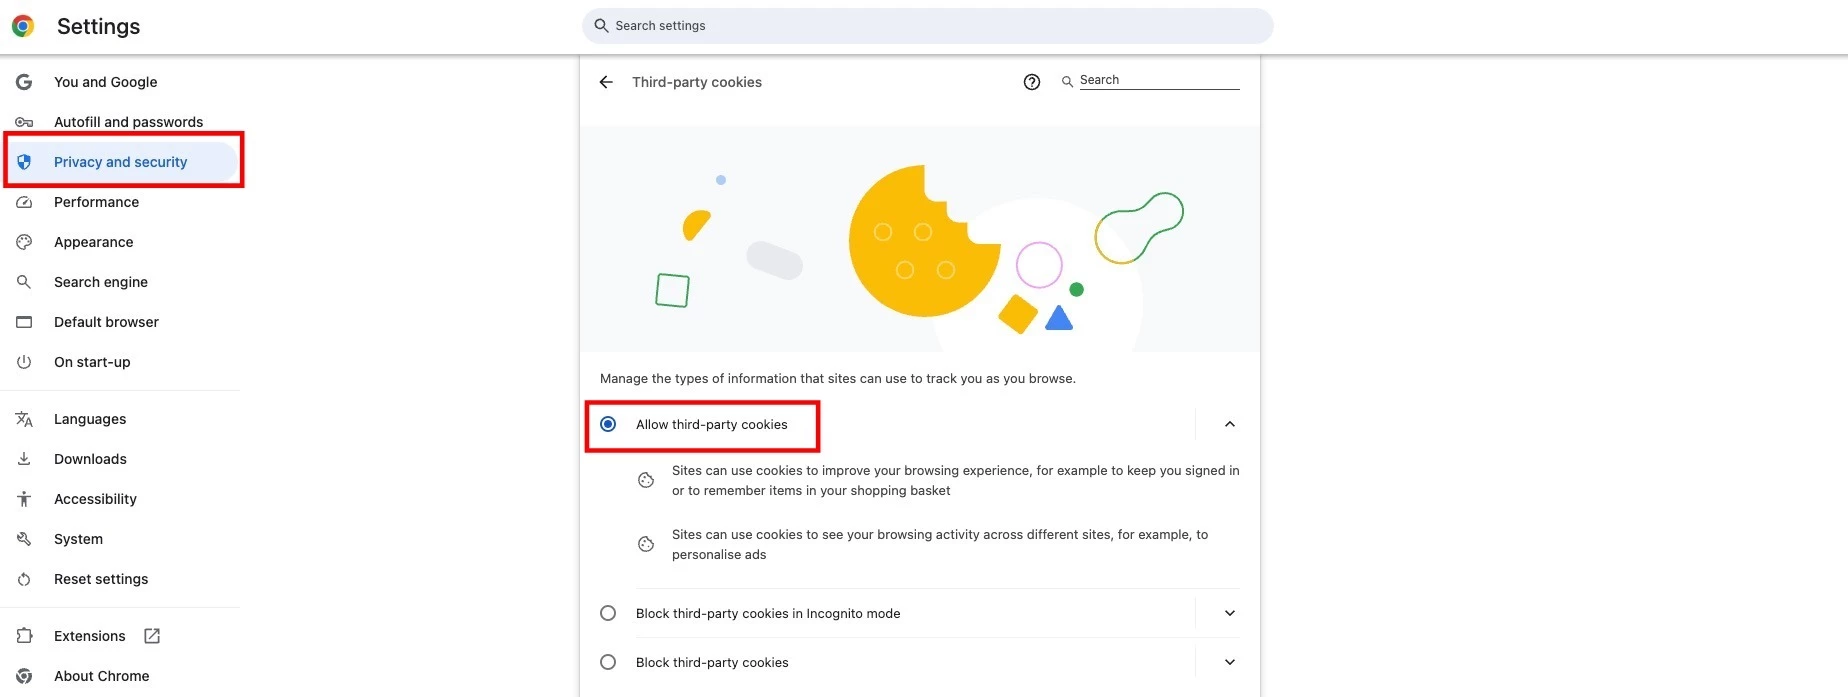
- Chrome: To enable cookies in Chrome, select the Allow third-party cookies checkbox.
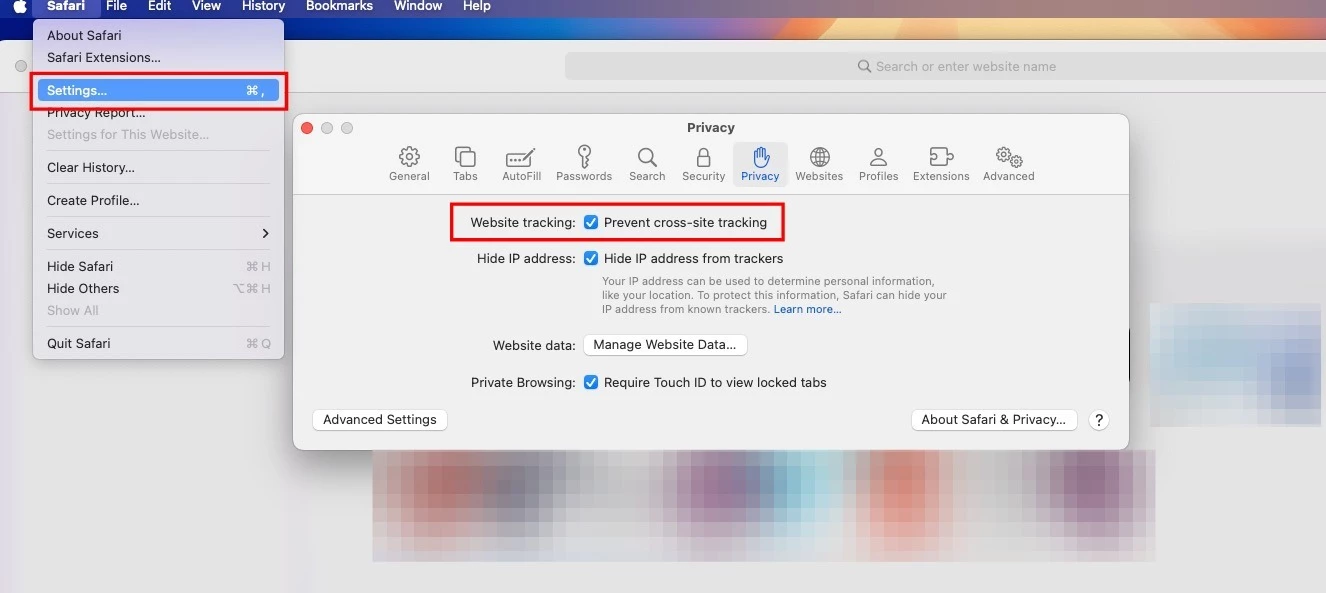
- Safari: To enable cookies in Safari, clear the Prevent cross-site tracking checkbox.
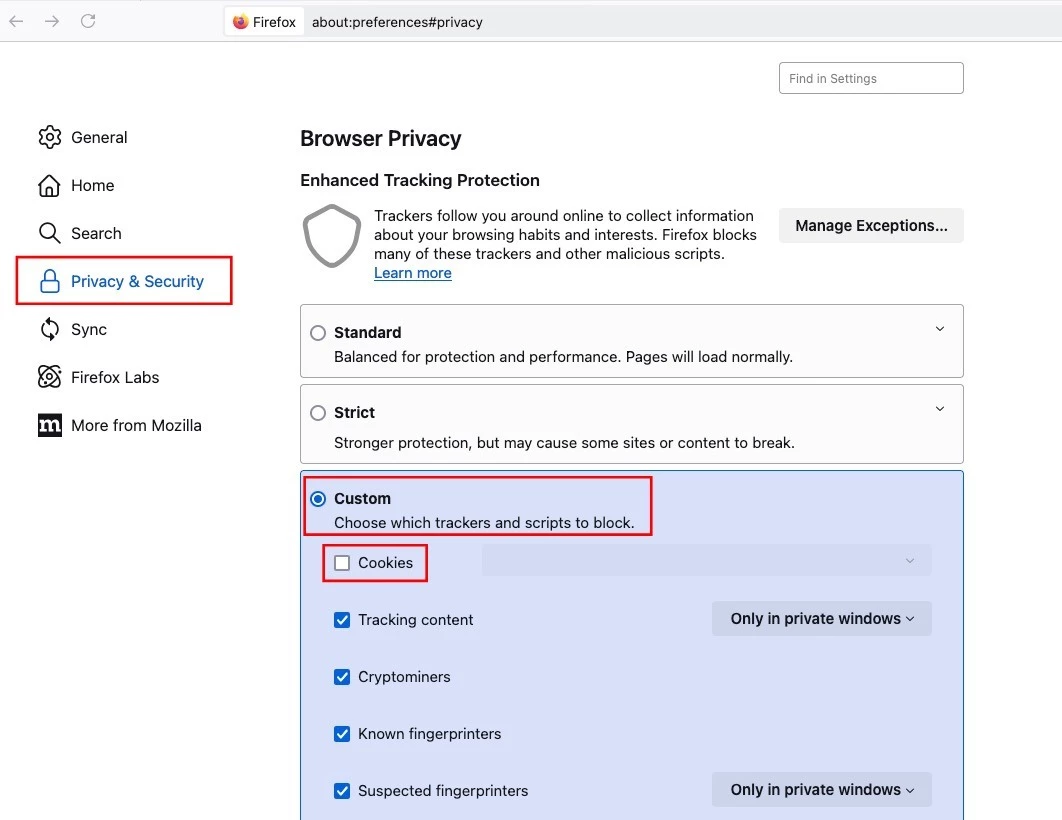
- Firefox: To enable cookies in Firefox, clear the Cookies checkbox in the Custom privacy settings.
- Chrome: To enable cookies in Chrome, select the Allow third-party cookies checkbox.
Limitation
- If the browser cookies are blocked as per the organization’s policy, New Dashboards will not be available on the Analytics page in Control. Gainsight is working to address this limitation soon.
Configure Dashboard Settings
The dashboard dropdown list contains the list of dashboards that are available under New Dashboards. Select the dashboard on which you want to apply the configured settings. The following settings are available:
- Favorite: Mark a dashboard as your favorite. The favorite dashboard appears at the top in the dashboard dropdown list.
- Refresh: Reload the entire dashboard to sync the latest changes.
- Global Filter: Apply filters globally on all KPI widgets and reports available on the dashboard. For more information, refer to the Apply Global Filter section.
- Download as PDF: Export the dashboard for offline reference in the .pdf format.
- Reset: Override any saved changes on the dashboard and restore it to the out-of-the-box configurations.
- Copy Dashboard URL: Share the dashboard’s URL with your team to promote collaboration.
Apply Global Filter
The Filters icon on the top of the dashboard allows you to apply filters at once to the KPI widgets and reports on which they are applicable. When you hover over any global filters, a blue border highlight appears on the reports and KPI widgets to which the selected global filter is applicable. This helps in identifying which global filter impacts which reports and widgets on the dashboard. The available global filters differ between dashboards.
Note: The Include Nulls checkbox is available for all global filters, KPI widgets, and reports. Select this checkbox to display records where the activity date is null. This checkbox is clear by default.
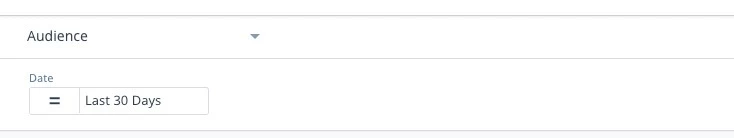
- Audience: The following global filters are available in the Audience dashboard:
- Date: Filter data based on a particular timeframe. By default, this filter is set to Last 30 Days. This filter is applicable to all KPI widgets and reports on the Audience dashboard.
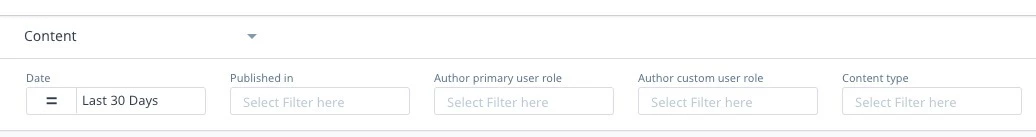
- Content: The following global filters are available in the Content dashboard:
- Date: Filter data based on a particular timeframe. By default, this filter is set to Last 30 Days. This filter is applicable to all KPI widgets and reports on the Content dashboard.
- Published in: Filter data based on the content category or group it is published in the community. Filter applies to the most recent category or group update. If the content has been moved between categories over time, only the last or current category or group is considered.
- Author primary/custom user role: Filter data based on the primary or custom user role assigned to the author of the topic. Filter applies to the most recent role update. If the author's user role has changed over time, only the last or current role is taken into account.
- Content type: FItler data based on the standard content types available in the community. Filter applies to the most recent content type update. If the content type has changed over time, only the last or current content type is considered.
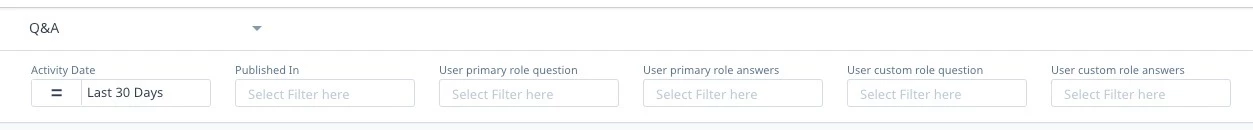
- Q&A: The following global filters are available in the Q&A dashboard:
- Activity Date: Filter data based on a particular timeframe. By default, this filter is set to Last 30 Days. This filter is applicable to all KPI widgets and reports on the Q&A dashboard.
- Published In: Filter data based on the content category it is published in the community. Filter applies to the most recent category or group update. If the content has been moved between categories over time, only the last or current category or group is considered.
- User primary/custom role question/answers: Filter topic-type questions and answers based on the primary or custom user role assigned to the author of the topic. Filter applies to the most recent role update. If the author's user role has changed over time, only the last or current role is taken into account.
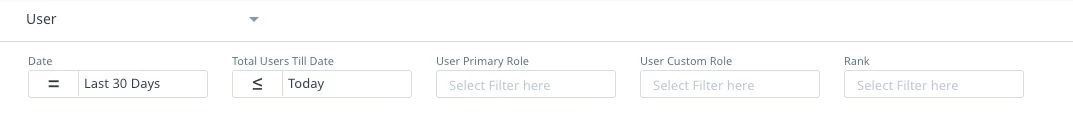
- User: The following global filters are available in the User dashboard.
- Date: Filter data based on a particular timeframe. By default, this filter is set to Last 30 Days. This filter is applicable to all KPI widgets and reports on the User dashboard.
- Total Users Till Date: Filter data based on the user activity up to the defined time period.
- User Primary/Custom Role: Filter data based on the primary or custom role assigned to the user. Filter applies to the most recent role update. If the author's user role has changed over time, only the last or current role is taken into account.
- Rank: Filter data based on the ranks assigned to users. Filter applies to the most recent rank update. If the rank has changed over time, only the last or current content type is considered.
Customize KPI Widgets
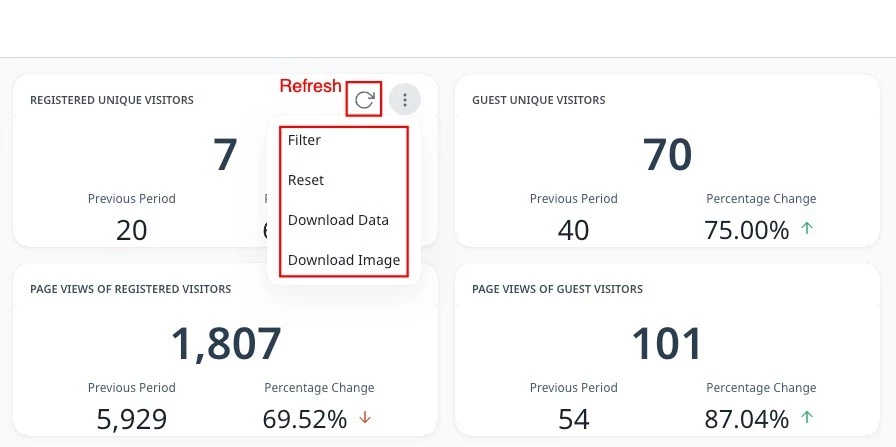
The following customization options are available on the KPI widgets:
- Refresh: Reloads the data used for KPI metric to provide the latest information. The last refresh date is displayed on hover.
- Filter: Displays the set of filters applied on the KPI. You can add more filters to customize the KPI. For more information on how to apply filters, refer to the Apply Filter section.
- Reset: Resets the KPI to its original configuration.
- Download Data: Exports the KPI data in the .xlsx format.
- Download Image: Takes a snapshot of the KPI and exports it in the .png format.
Customize Reports
Customization options on reports allow you to personalize a report based on your requirements. However, it is important to note that customization options differ between report types. The following customization options are available for reports:
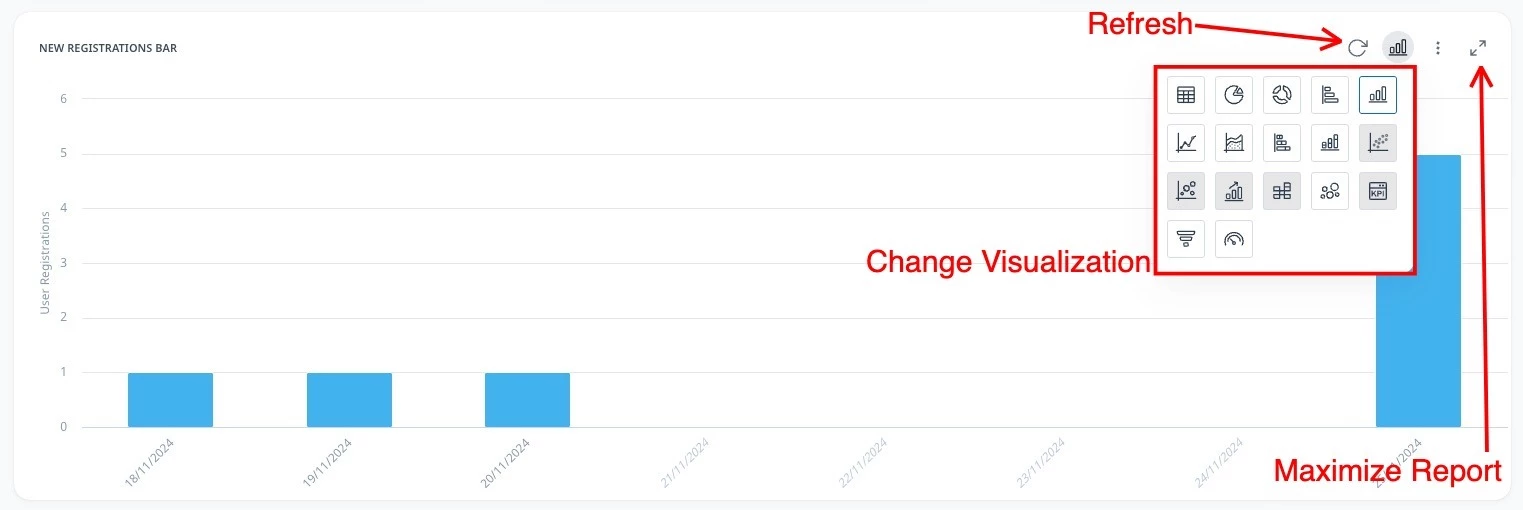
- Refresh: Reloads the data on which the report is calculated to give the latest information. The last refresh date is displayed on hover.
- Change visualization: Provides an option to change how the report is displayed. The available visualization options are table, pie chart, donut, stacked column, packed bubble, and more. Visualization options that are grayed out are unavailable for a particular report.
- Maximize report: Expands the report on the page for a better viewing experience.
- Filter: Displays the set of filters applied to the report. You can add more filters to customize the report. For more information on how to apply filters, refer to the Apply Filter section.
- Reset: Resets the report to its original configuration.
- Download Data: Exports the report in the .xlsx format.
- Download Image: Takes a snapshot of the report and exports it in the .png format.
- Row Height: Adjusts the row height for a neat viewing experience. The available options are Small, Medium, and Large.
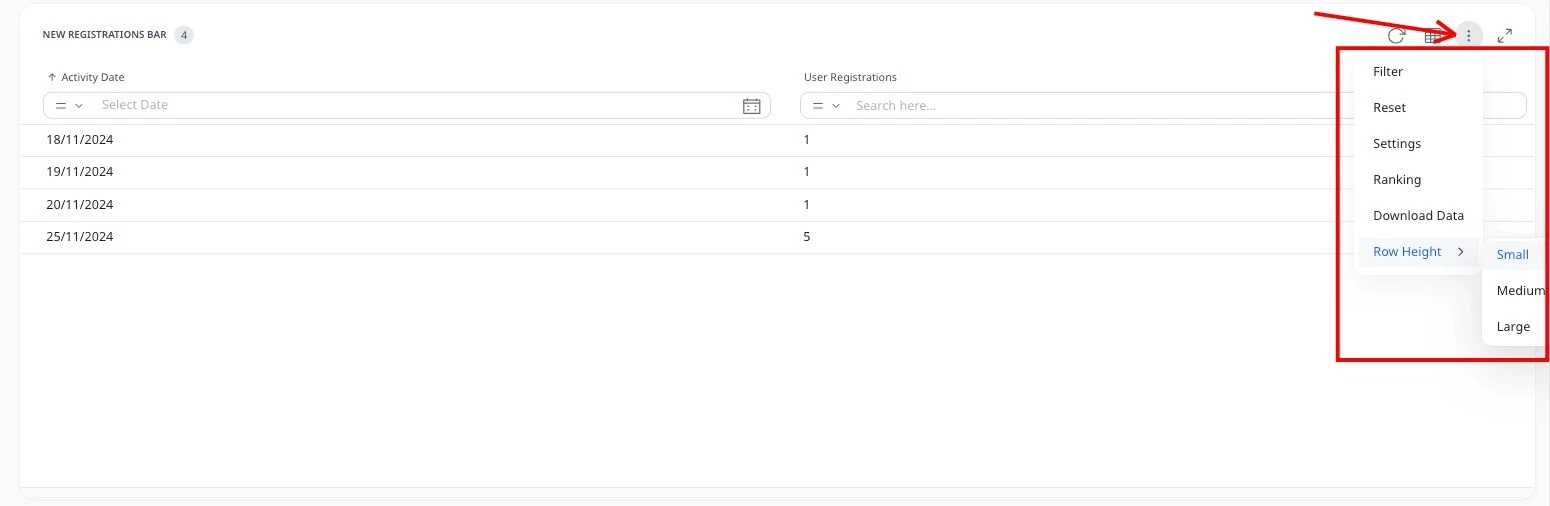
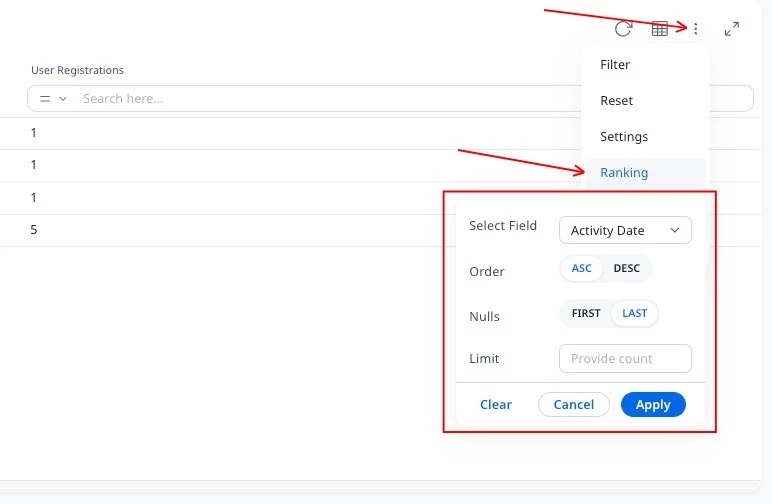
- Ranking: Adjusts the report based on configured rank settings.
- Select Field: Field on which you want to rank the report.
- Order: Ascending or Descending order on which you want to arrange the report. The default option is ascending.
- Nulls: Determine where the null values should appear in the report.
- Limit: The number of rows that should appear in the report.
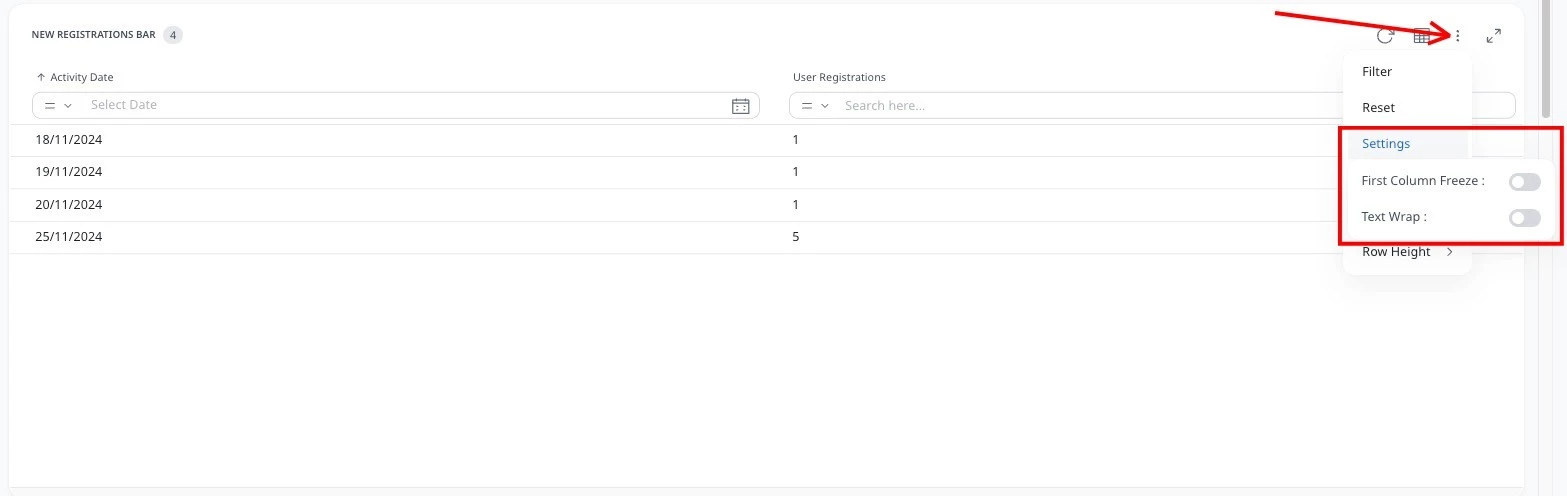
- Settings: Advanced report settings to configure the report based on your requirements. The list of settings may vary based on the active report visualization.
- First Column Freeze: Freezes the first column in the report with tabular visualization.
- Text Wrap: Breaks long text into multiple lines to adjust according to the column width.
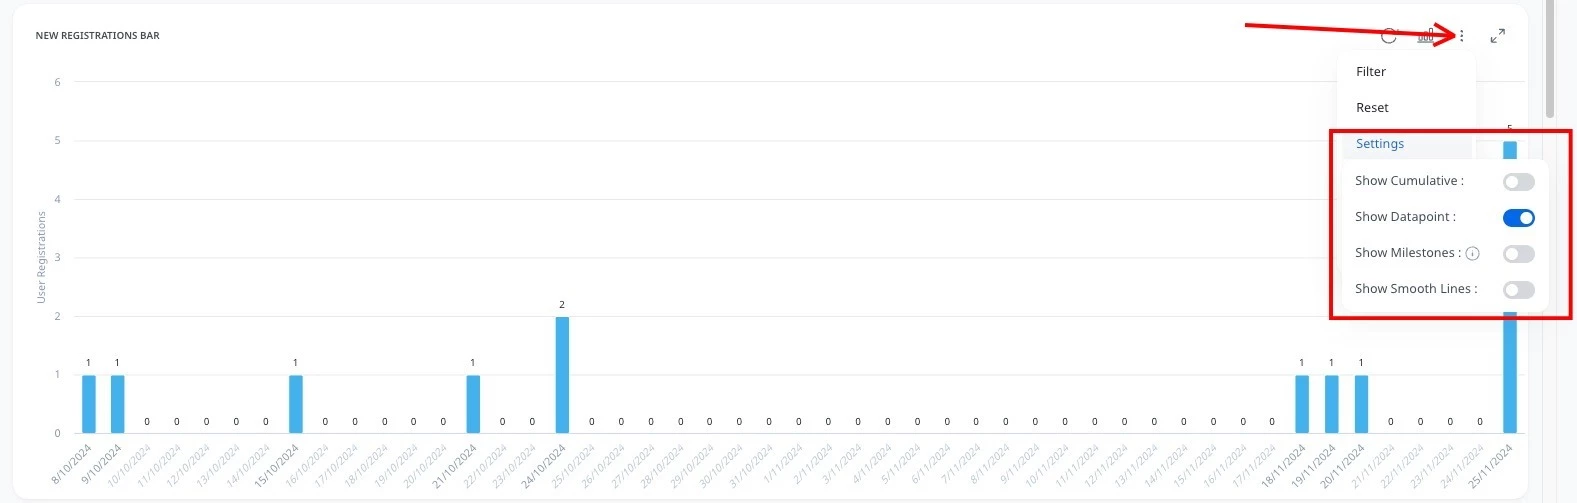
- Show Datapoint: Displays the datapoints in the report.
- Show Cumulative: Displays data for each data point as the sum total of preceding data points.
- Show Milestone: Displays milestone events for companies or accounts in the report. This setting is only available when the report is filtered based on a company or an account.
- Show Smooth Lines: Displays the line charts using smooth lines instead of straight lines for easier comprehension and better visualization.
- Normalize: Displays the first value in the result which is baseline or zero. Subsequent values display whether they have been increasing/decreasing and by what % with reference to the previous value.
- Maximum Value: Sets the maximum value in the Gauge chart report, which is used as the base value for the data range.
- Show Dual Y-Axis: Displays data comparison between two data sets with a common X-Axis.
- Sort Data in Columns: Sort data in tabular reports by sorting column data in ascending or descending order.
- Filter Data in Columns: Filter data in tabular reports by applying filters on column data using different operators.
Apply Filter
The following two filter types are available:
- Filter on Fields: This filter type allows you to filter reports and KPI widgets based on fields available in the objects. These objects hold data from where the reports and widgets fetch information.
To apply the filter on fields:
- Click Filter. The Filter dialog box appears.
- Click Add Filter in the Filter on Field section.
- From the Field dropdown, select the field on which you want to apply the filter.
- From the Input Type dropdown, select Value or Field. The operator changes based on the input type selected.
- From the Operator dropdown, select the operator based on which the filter should function.
- From the Value dropdown, select the value or field based on which the filter is applied on the report of the KPI widget.
- (Optional) Select the Include Nulls checkbox to include nulls values in the filtered results.
- (Optional) Click the delete icon to remove additional filters.
Note: Any additional filters are always applied using the AND logic.

- Filter on Measures: This filter type is pre-configured to populate data in a few out of the box reports. Currently, you do not need to configure this filter type.
If you have any queries or feedback, please drop an email to docs@gainsight.com or post a reply to this article.
