Solved
Chart Showing Yes/No (or True/False) Count For Multiple Fields
I have gathered information from various sources and compiled all values into an MDA table. For example, how many times and account did X in a certain time period. This table also contains a boolean field corresponding to each value field. If the value is greater than 0, the boolean field is True, otherwise, False.
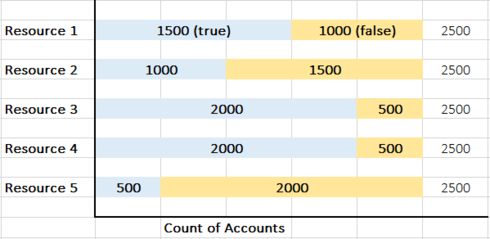
I want to use this information to create a table that shows a count of all accounts and how many are either True or False for these fields. An example mock up looks like this:
Each "Resource", as I'm calling them here, is a boolean field in the MDA table. In this example, we have 2500 accounts and they all have either a True or False value for each field. I can't figure out how to get a report that looks like this - is it possible?
Thanks for any help or suggestions!
I want to use this information to create a table that shows a count of all accounts and how many are either True or False for these fields. An example mock up looks like this:
Each "Resource", as I'm calling them here, is a boolean field in the MDA table. In this example, we have 2500 accounts and they all have either a True or False value for each field. I can't figure out how to get a report that looks like this - is it possible?
Thanks for any help or suggestions!