

andreammelde
Helper ⭐️⭐️
Nov 23, 2020 9:03 PM UTC
Solved

Display a Report in a CTA?

In an effort to not overwhelm a CSM’s cockpit, we are wanting to create a CTA that aggregates survey responses over the previous week. How can I include in the notes a report of the survey response and what they responded?
andreammelde
Helper ⭐️⭐️
Jan 13, 2021 3:20 PM UTC

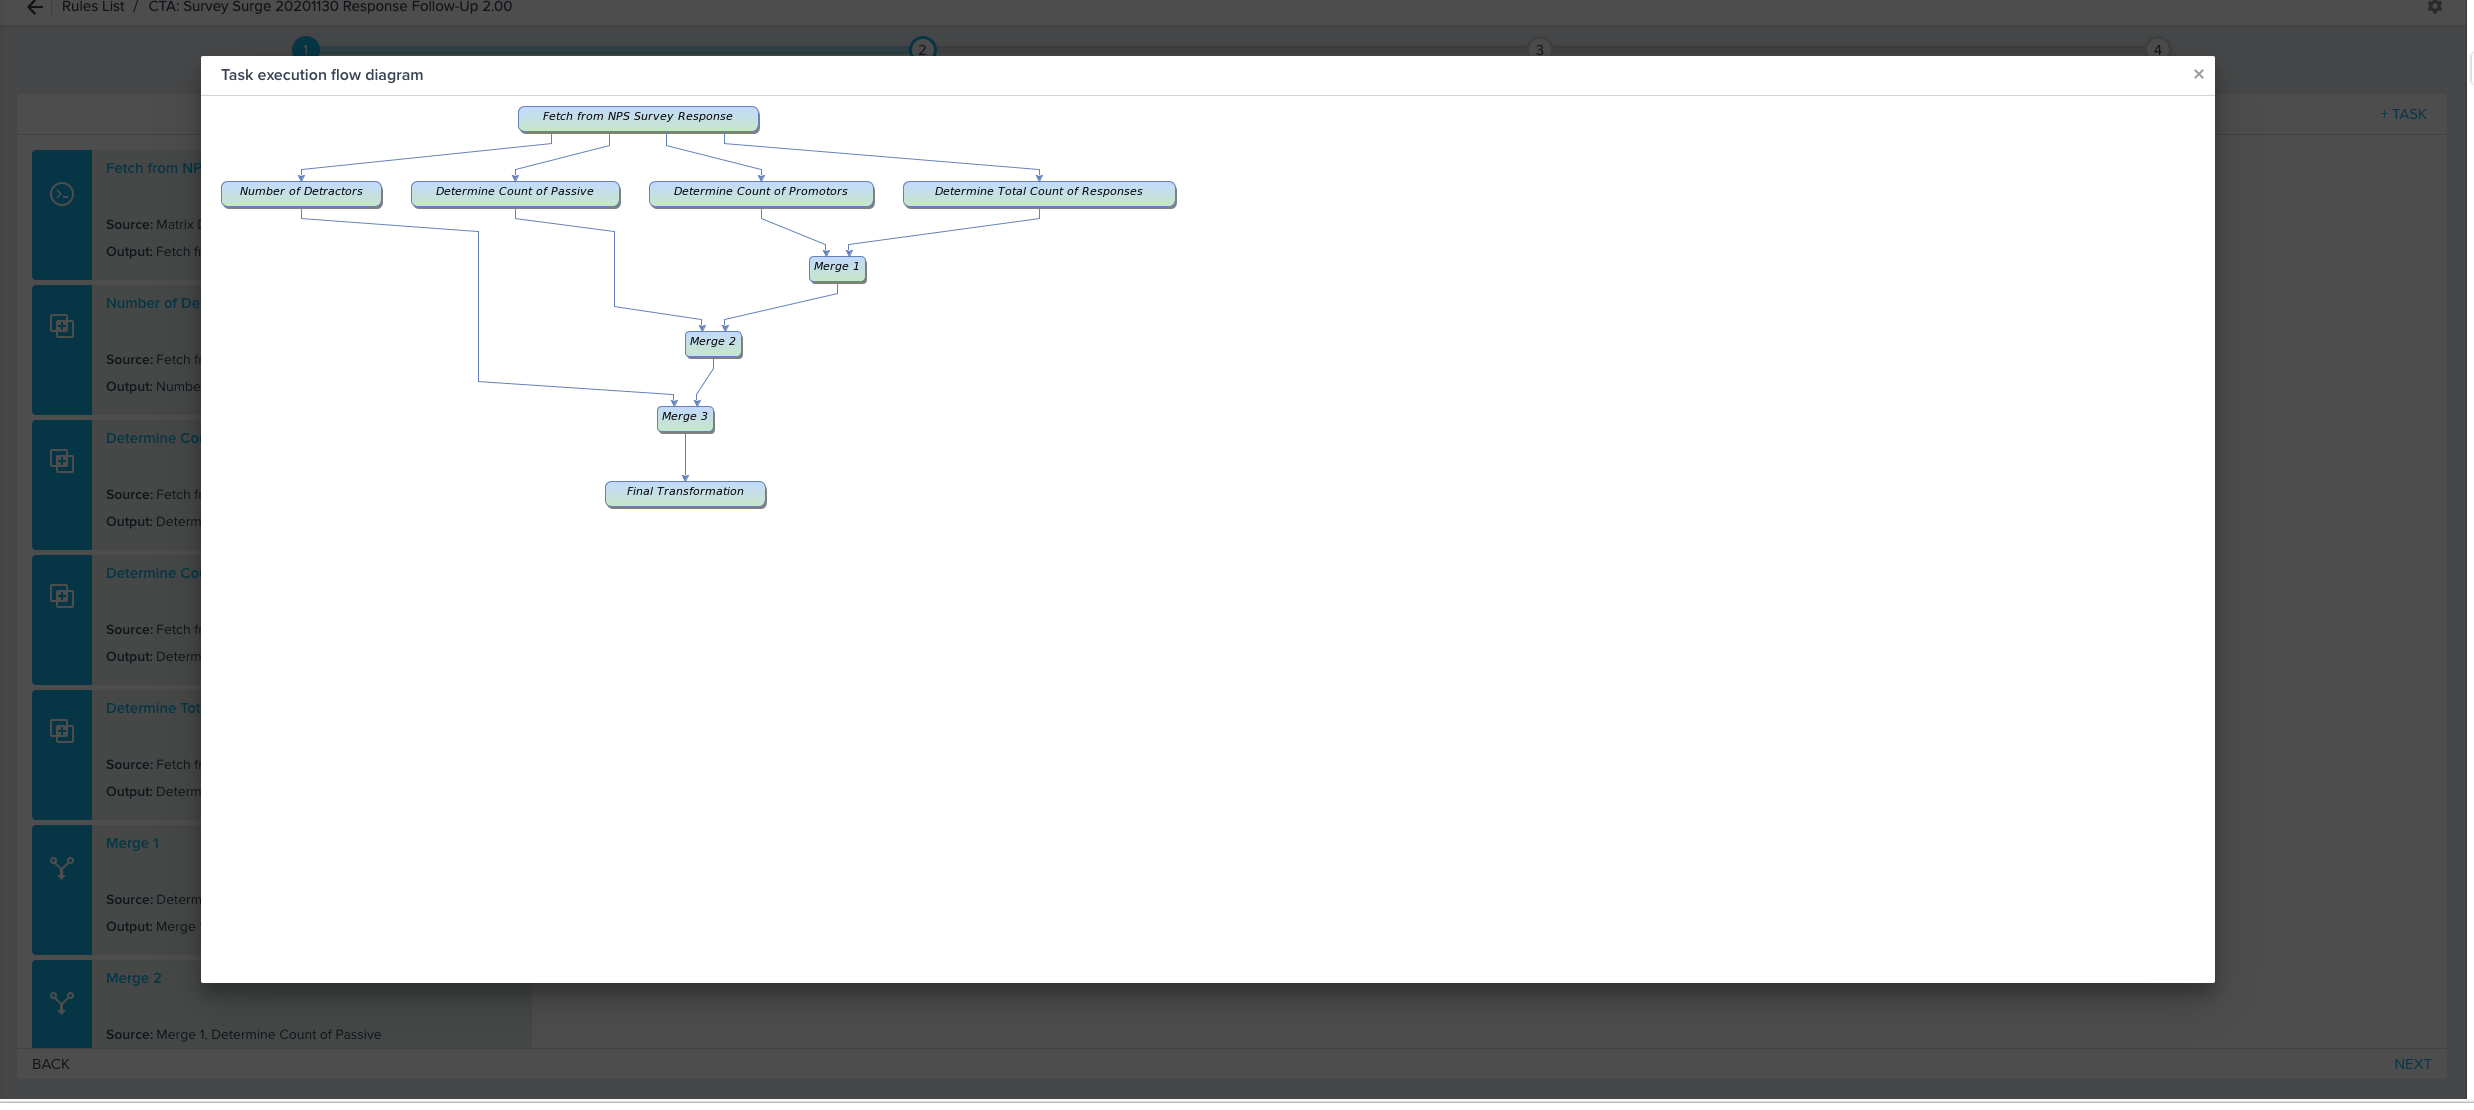
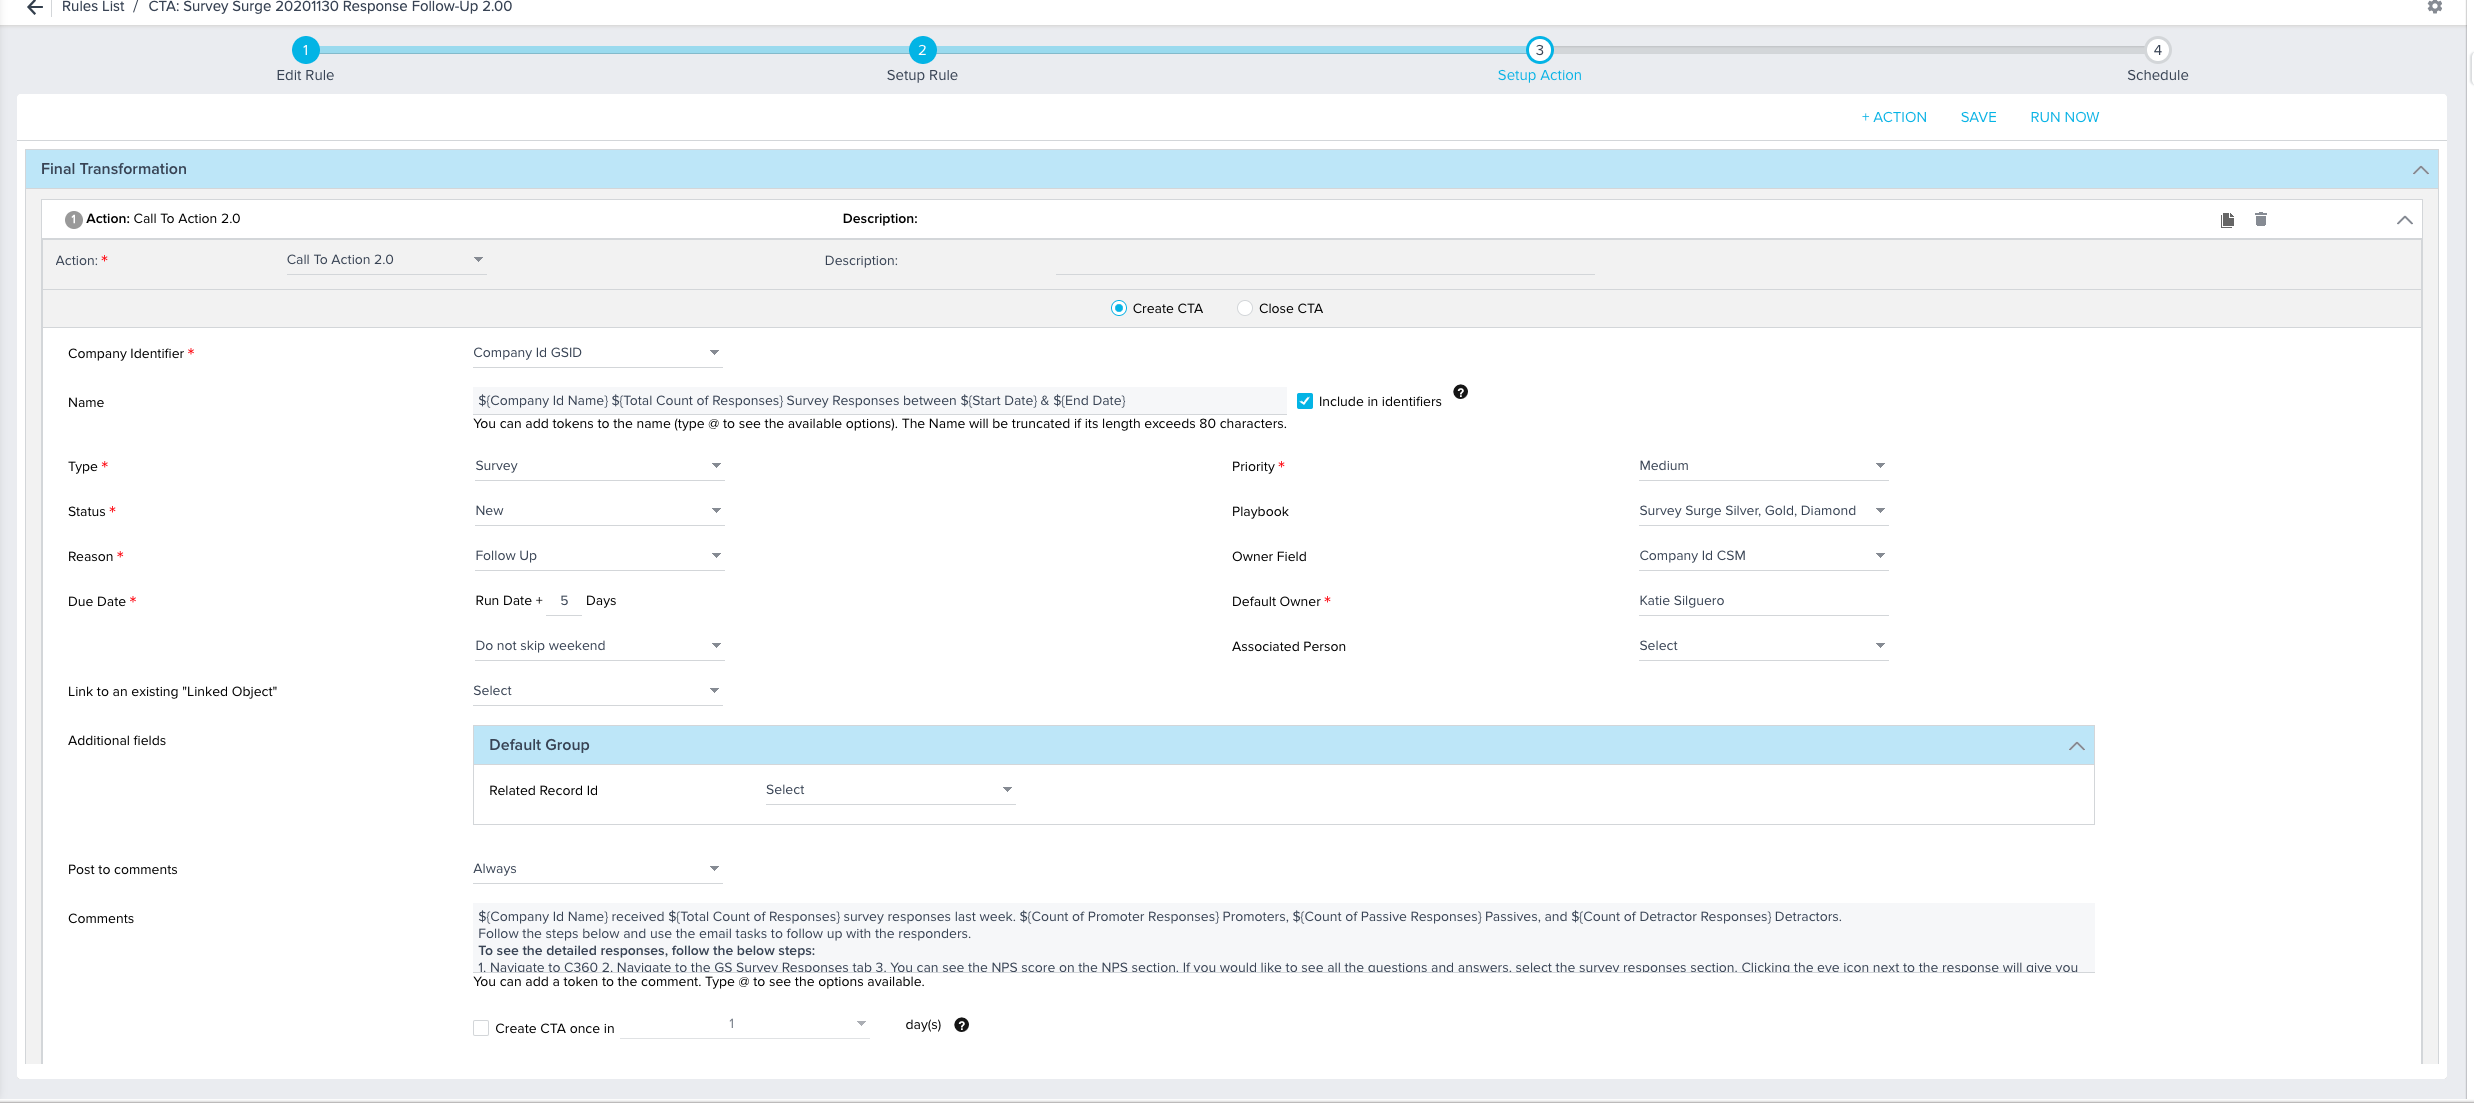
Here is the logic and the action with the tokens


Andrea Carroll

13 replies

dan_ahrens
Expert ⭐️⭐️⭐️
Nov 24, 2020 4:23 AM UTC

Hi @andreammelde - how many variables from the survey are you looking to include in the CTA notes? If you pull in the data you want to include in the survey results in the rule setup you can tokenize the comments and have that data represented in the CTA creation step: https://support.gainsight.com/SFDC_Edition/Cockpit_and_Playbooks/Admin_Guides/11_Creating_and_Closing_CTAs_from_Rules_Engine#Creating_CTAs_from_Rules_Engine

Translate
VP of Customer Success at Forcepoint
andreammelde
Helper ⭐️⭐️
Nov 24, 2020 3:44 PM UTC

@dan_ahrens  the thing is we want to aggregate multiple survey responses and detail the email, score, and notes on the CTA. so it’s not just columns to tokenize, but it’s aggregating multiple rows of data.


We are sending a survey with a large audience and want to trigger the CTA to fire on Monday for the all the responses received the week prior and list each response. Pivot and then concatenating doesn’t really work for this

Translate
Andrea Carroll
andreammelde
Helper ⭐️⭐️
Nov 25, 2020 9:43 PM UTC

@dan_ahrens we also want to provide the info in the CTA to limit CSMs having to toggle between reports on the C360 as much as possible

Translate
Andrea Carroll
dan_ahrens
Expert ⭐️⭐️⭐️
Nov 30, 2020 10:29 PM UTC

This is helpful information, thanks @andreammelde . For the rule that creates the CTA - what is the triggering criteria? Does it fire the CTA on the first survey response or does it wait for a set number of responses or a set amount of time before the CTA is fired? 

The way that CTA comments are structured, you can’t really embed a whole report, but you could look to present the most relevant information in the CTA comments. Short of that, the option you outlined of a section in the C360 with the report and/or a dashboard view with a global filter that would allow the user to select a specific customer or region or other logical grouping to aggregate on. 

Translate
VP of Customer Success at Forcepoint
andreammelde
Helper ⭐️⭐️
Nov 30, 2020 11:04 PM UTC

@dan_ahrens  it would trigger every Monday, and count how many surveys were received the week before. The amount could vary each week

Translate
Andrea Carroll
gunjanm
Expert ⭐️
Dec 1, 2020 5:17 AM UTC

@andreammelde would a report-based email template in a JO do the trick? Tabular reports are not supported though, so you may need to try something out, based on the level of detail you’re looking for...

Translate
Gunjan
andreammelde
Helper ⭐️⭐️
Dec 1, 2020 2:19 PM UTC

it might - but the goal was to hopefully list all the emails so that the CSM could use the email assist task to send a follow up and not have to leave Cockpit as much as possible.


We have seen a big drop off in CSMs following up on NPS CTAs when they have to toggle between areas.


However, this is a one off program. We sent over 1400 requests for survey response whereas our normal monthly one will only be a couple hundred and can be individual.


Translate
Andrea Carroll
andreammelde
Helper ⭐️⭐️
Dec 1, 2020 3:24 PM UTC

My idea is to create a low volume GS object and send a few key data points from the NPS Survey Response object, and then link the low volume object to the CTA.


Is it possible to have multiple records link to one CTA if I use the Company GSID to link?

Translate
Andrea Carroll
sai_ram
Expert ⭐️⭐️
Jan 4, 2021 11:12 AM UTC

@gunjanm please have a look at @andreammelde comments. 

Translate
andreammelde
Helper ⭐️⭐️
Jan 4, 2021 5:21 PM UTC

I was able to set up the rule to count the GSID of each survey type and then use that as token in the comments instead of displaying a chart

Translate
Andrea Carroll