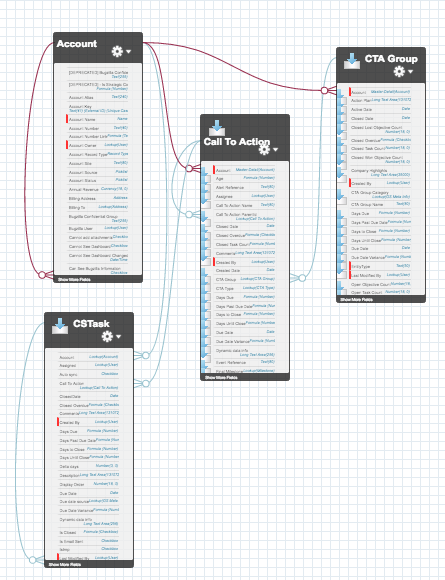
I'm one of those folks who needs to see the data structure to really understand what's happening behind the scenes. So, I've created 3 ERDs (entity relationship diagrams) for the main functions of Gainsight.


Here they are, in no particular order:


  1. Surveys


  2. Scorecards


  3. CTAs & Tasks


Very nice! Looks great...how will you use it for GS?
I'm in learning mode having recently started in this position. Having the ERDs handy helps me visualize the relationships between data and troubleshoot issues.


Also, Schema Builder just makes me smile! 🙂
Very helpful....just the other day I deleted an unwanted test survey. Having the ERD would have saved a few steps.
So awesome!!!
Love it! You may want to add CTAGroup to the CTAs, which represents Success Plans
Duly noted! Thanks!


So fast on the draw!! 🙂
Love the workflows, is there a way to make the images larger? When I try to zoom in everything gets fuzzy...
I tried 8 different ways to make these better/bigger/less fuzzy and came up empty. You can create these for yourself (assuming you have the correct permissions) using the Salesforce Schema Builder. More info on that tool here: https://help.salesforce.com/articleView?id=schema_builder_working.htm&type=0&language=en_US&...
Amber this is fantastic! Thanks for sharing this. Especially as admins, as you create data space knowing the data schema will be really helpful. While not as graphical as above, data space UI does provide another way to understand the 'erd'. 

Reply