Solved

Monthly Progress reports via JO

  • November 14, 2018
  • 3 replies
  • 55 views

sarah_kiani
Hi all!

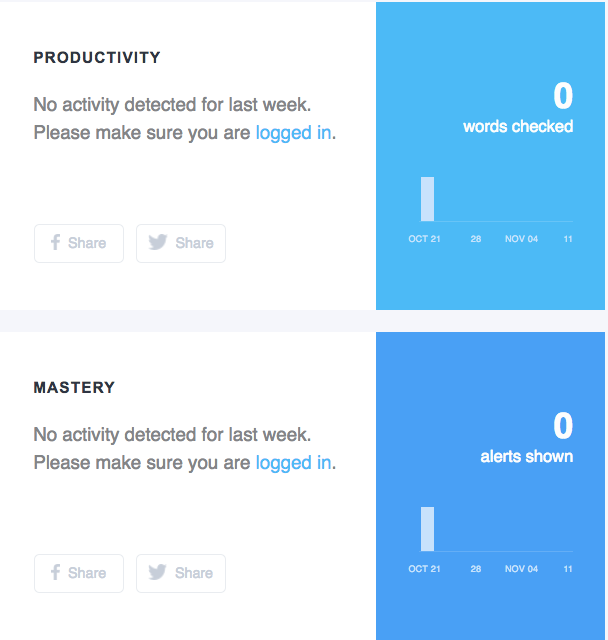
Our CS team is planning to send out monthly progress reports to customers so they know where they are at on some important metrics. I am curious if someone has leveraged Gainsight to do this. I know we can tokenize practically any field from Salesforce but ideally, we would like to integrate graphs that can also show trends. The challenge here is to automatically populate the graphs for the particular contact's account. Here's how the structure would roughly look:


Is this beyond JO's scope for now? Would love some insight if someone is using JO for sending out automatically populating progress reports.
Best answer by jeremy_curry

Hi Sarah,

If you track these metrics currently by date, you should be able to add a report containing your data into the email template. I have also seen people take snapshots of the metrics and load them into an MDA table, tokenize the data, and then add them into a graph that they generate via HTML within the email template.

3 replies

jeremy_curry
  • Helper ⭐️⭐️
  • Answer
  • November 14, 2018
Hi Sarah,

If you track these metrics currently by date, you should be able to add a report containing your data into the email template. I have also seen people take snapshots of the metrics and load them into an MDA table, tokenize the data, and then add them into a graph that they generate via HTML within the email template.


sarah_kiani
  • Author
  • Contributor ⭐️⭐️⭐️⭐️⭐️
  • November 29, 2018
Thanks Jeremy! We are on our way to doing exactly that :)


sarah_kiani
  • Author
  • Contributor ⭐️⭐️⭐️⭐️⭐️
  • December 7, 2018
Hi Jeremy!

Curious if your org has ever added dynamic images in such an email? I understand the process to add in graphs through the report placeholder with the steps you outlined but wondering if we can go one step further with images that change depending on the company id