Our leadership team wants a report to show 2 things:


1. Total CTAs Completed


2. Total CTAs Completed by Due Date


Currently, we're just exporting the raw CTA data from GS into Excel or into Tableau reports. Has anyone created a similar report directly in GS?  Is it possible?
Hi Heather, is this along the lines of what you are trying to accomplish?


Here's an example:


So basically what you need is a formula field that tracks the number of instances where the close date was later than the original due date, right?
Yes please.  :)
So there are a number of fields that you could use to measure if a CTA was overdue:


But unfortunately you won't be able to create that visualization that you have in the sample with the mix of 1 column data and two line data sets. 


You could represent the data visually with a different visualization (3 columns for example) and use an MDA table to store the data. Use the new formula field feature in bionic rules to calculate the number of CTAs that were closed and overdue. 
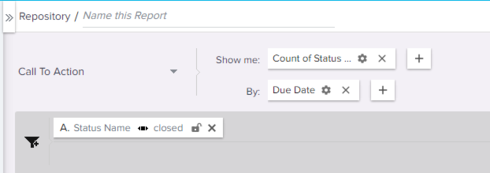
This is probably the closest we can come when reporting directly on the Call To Action object:


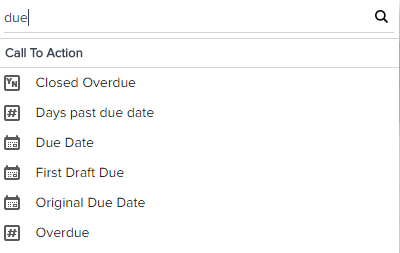
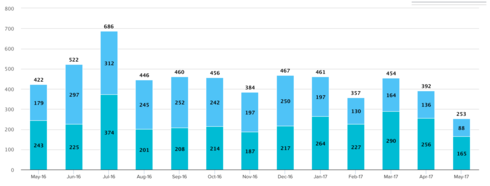
For example, in July 2016, we completed a total of 686 CTAs, with 312 (45.48%) closing on time and 374 (54.52) closing overdue (after the due date). 'Closed Overdue' is calculated using 'Due Date', but we could create a new formula field that calculates on 'Original Due Date' instead.


So, I don't have a Closed Overdue field as an option in the Call to Action.  Is that something that we'll have to create on our side first?
It looks to be a standard field as part of our package.  If you wanted to make it yourself, you can use this formula checkbox syntax:


IF( JBCXM__ClosedDate__c > JBCXM__DueDate__c , TRUE,FALSE)
It's standard, as Scott mentioned. Most likely a permissions issue. Would you be able to edit our permission set, grant access to this field, and retry?

Reply