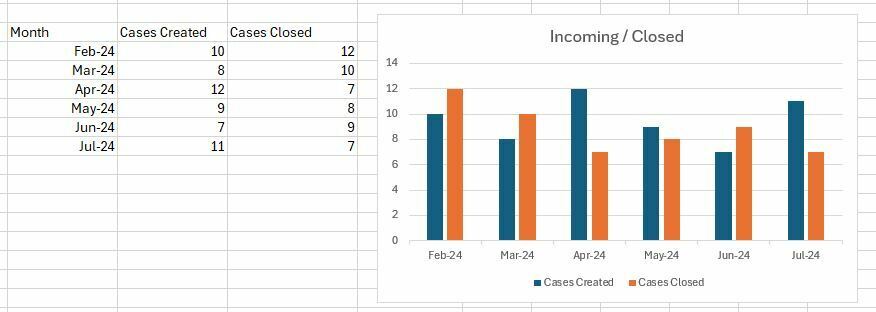
Im trying to create an Incoming / Closed trend report which is using two date fields (Date Created and Date Closed). Is there a way to have this report created in Gainsight? Right now we have this as two separate graph widgets.

Im trying to create an Incoming / Closed trend report which is using two date fields (Date Created and Date Closed). Is there a way to have this report created in Gainsight? Right now we have this as two separate graph widgets.

Best answer by matthew_lind
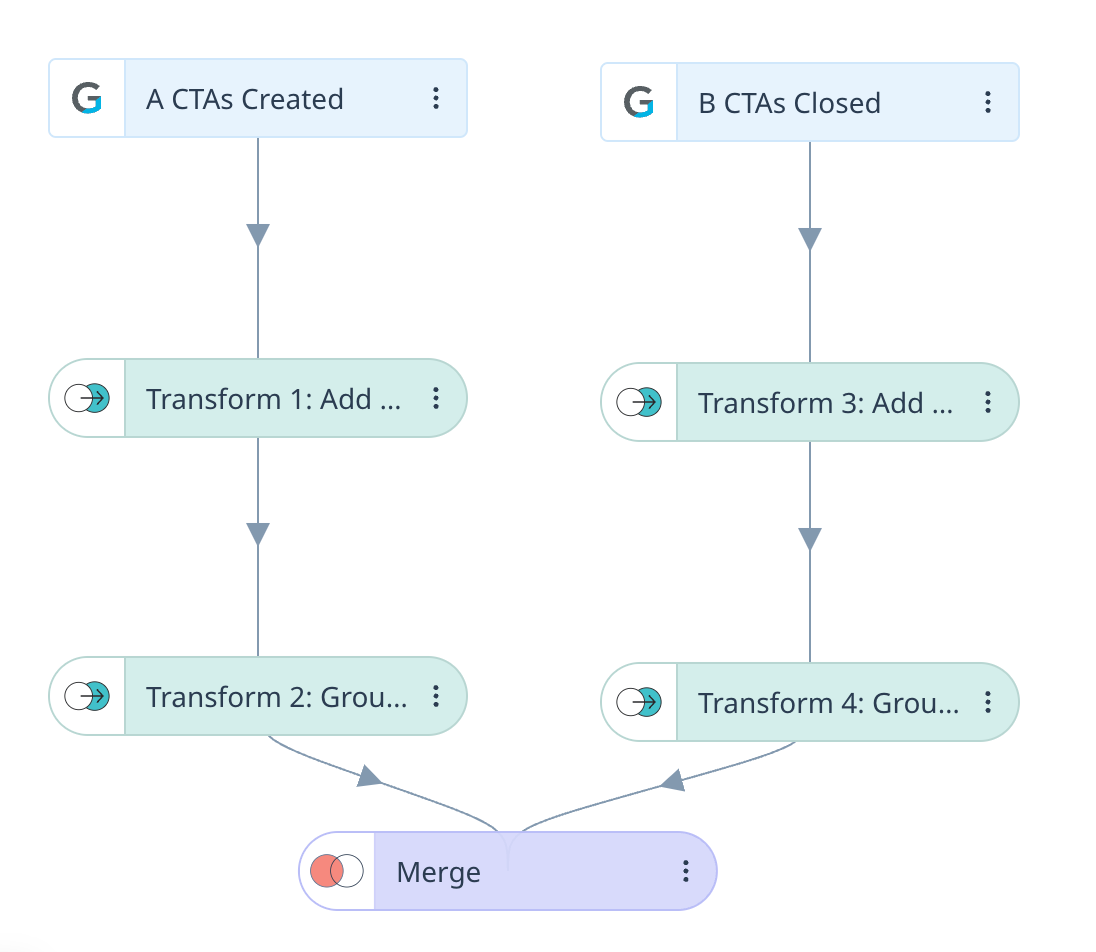
Yes, it can be done, but not exclusively with the Report Builder. I have done this with Data Designer (DD), looking at CTA velocity, comparing Created to Closed, to determine how well the team is “keeping up” with CTAs.
Report builder doesn’t work because each record has its own Create Date and Close Date, and they’ll always be separate fields on a common record. You essentially need to create a dataset where a Date (or a Week or a Month) is identified, then the Cases created and Cases closed on that Date (or Time Period).
I followed these general steps, and am attaching a screenshot based on CTAs. Just sub in Cases, based on your need:
Your final dataset will be one row per month, with the count of the number of Cases Created, and the number of Cases Closed in each month.
Note that you’ll have limited drill-down capabilities, as you “lose” the individual record details by performing these steps. However, you can get to the trending you desire.
With that as your Data Designer, you can then build the Reports you want in Report Builder.

If you ever had a profile with us, there's no need to create another one.
Don't worry if your email address has since changed, or you can't remember your login, just let us know at community@gainsight.com and we'll help you get started from where you left.
Else, please continue with the registration below.
Enter your E-mail address. We'll send you an e-mail with instructions to reset your password.