Solved

Success Plan Gantt chart display

  • December 15, 2017
  • 3 replies
  • 67 views

cameron_wright
Forum|alt.badge.img+2
By design the Gantt Charts will display for all tasks and objectives.
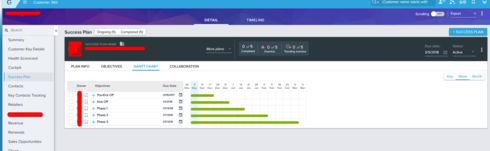
Then when you expand and condense the objective "Gantt Chart" will disappear for that objective tasks which we know.

The customer that brought this to our attention would like for when you condense the objective that the "green line" also get condensed. 

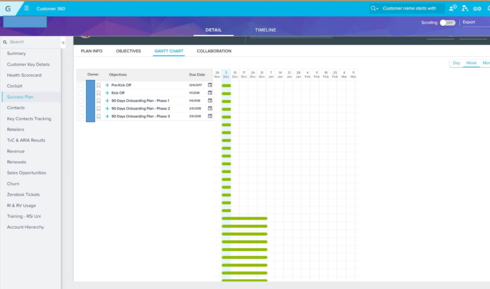
I do agree with the user as if you condense something, related content should respond also. Image attached is the condensed view

Best answer by hitesh_sharma

Hi Cameron,

This is an issue with Gantt Chart which is seen when you Switch View (Weeks or Months). I have raised an Internal Bug for the same.

Regards,
Hitesh

3 replies

katerina_nemcova
Forum|alt.badge.img+1
Thanks Cameron - would love to see the bars condense also when tasks are condensed!


Forum|alt.badge.img+1
  • Gainsight Employee ⭐️
  • Answer
  • December 16, 2017
Hi Cameron,

This is an issue with Gantt Chart which is seen when you Switch View (Weeks or Months). I have raised an Internal Bug for the same.

Regards,
Hitesh

cameron_wright
Forum|alt.badge.img+2
  • Author
  • Gainsight Employee ⭐️⭐️
  • December 20, 2017
Thank you for the update Hitesh!