
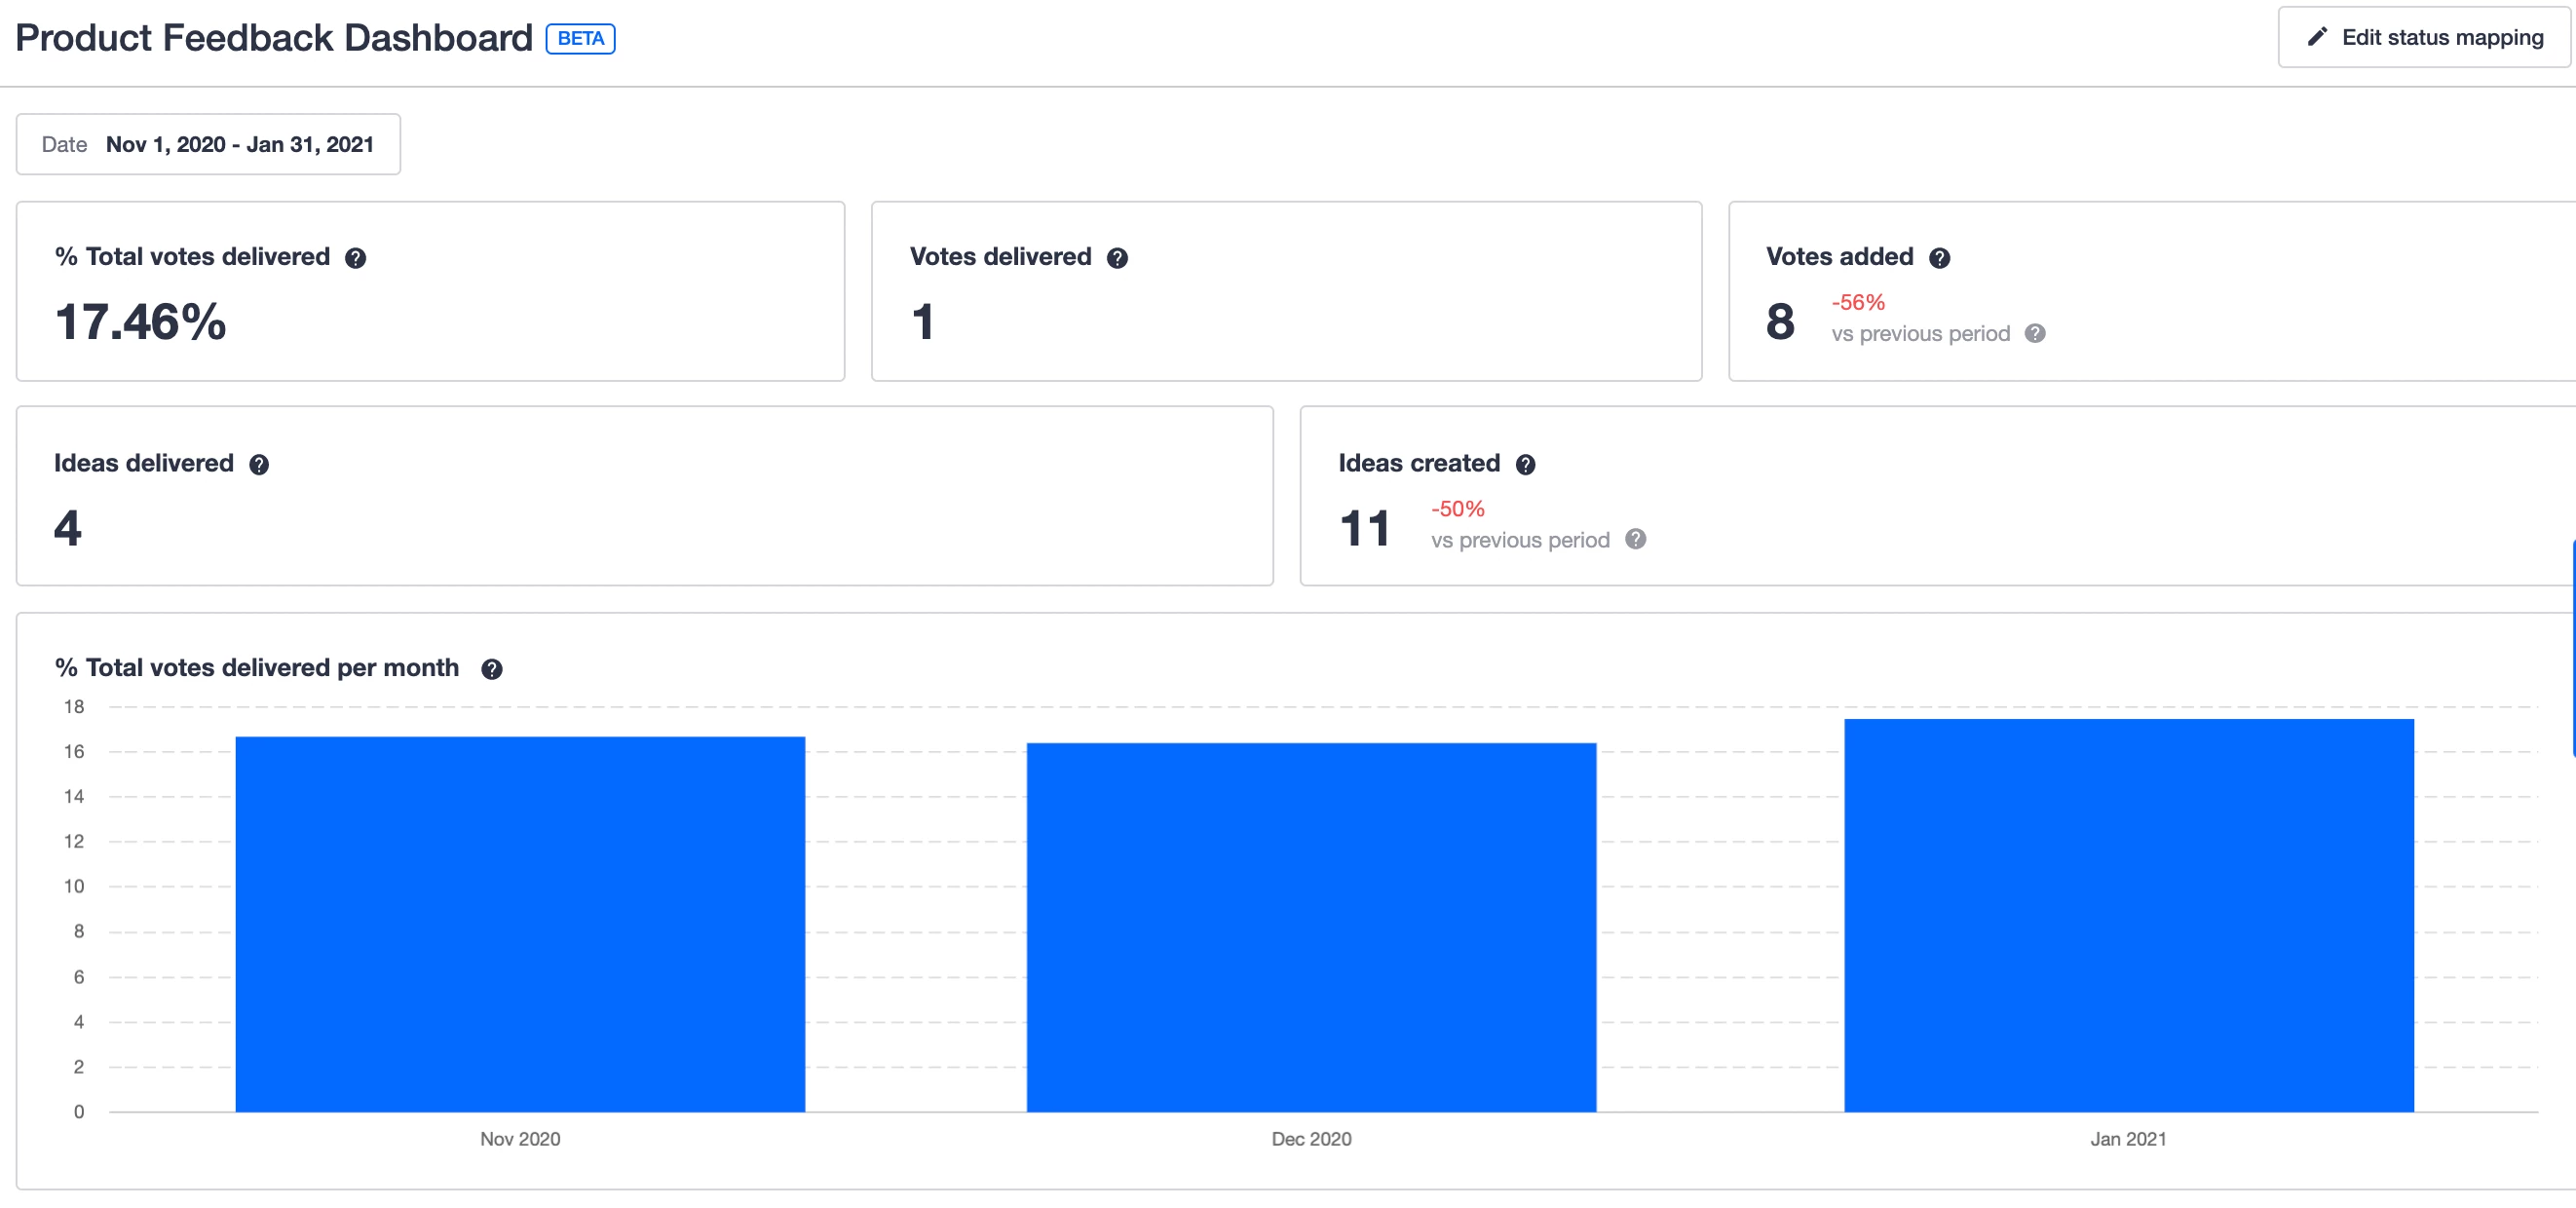
The product feedback dashboard shows how well you’re delivering on the ideas that your users vote for and submit.
This dashboard helps you see whether you’re on track to excel at managing your users’ expectations, or whether your ideation section is trending towards disappointment and frustration.
Value metric: % Total votes delivered
The value metric for the product feedback dashboard is % Total votes delivered. We believe that this metric is a leading indicator for customer NPS.
A good % total votes delivered result is highly dependent on your user base and how you’re managing their expectations around community ideation. The calculation is: Cumulative delivered votes / (Cumulative delivered votes + Cumulative open votes).
We exclude closed votes from this calculation, since you’ve already managed your customers’ expectations around these ideas.
Metric reference: Product feedback dashboard
This table explains in detail how each metric shown on the product feedback dashboard behaves, and any limitations or behaviours to watch out for:
| Metric | Description | Extra Details |
| % Total votes delivered | The percentage of total cumulative votes delivered up to the end of the selected time period. | Calculation: cumulative delivered votes / (cumulative delivered votes + cumulative open votes) Excludes votes with ‘closed’ status and votes from trashed ideas |
| Votes delivered | The number of idea votes delivered in the selected time period. | The same vote is never counted twice for votes delivered. For example, if an idea changes status (e.g. from delivered, to open, back to delivered again)… and the selected date range covers the status changes, then the votes are only counted as being delivered ‘once’. Excludes votes from trashed ideas. |
| Votes added | The number of votes added to ideas in the selected time period. | If a user unvotes an idea, the vote will not be counted in this metric from the date of the unvote onwards. If two ideas are merged and the same user voted on both ideas, only one vote will be counted. Excludes votes from trashed ideas. |
| Votes added % change | The percentage difference between the number of votes added to ideas in the current/previous time period. | - |
| Ideas delivered | The number of ideas delivered in the selected time period. | The same idea is never counted twice for ideas delivered. For example, if an idea changes status (e.g. from delivered, to open, back to delivered again)… and the selected date range covers the status changes, then the idea is only counted as being delivered ‘once’. Excludes votes from trashed ideas. |
| Ideas created | The number of ideas created in the selected time period. | Excludes trashed ideas. |
| Ideas created % change | The percentage difference between the number of ideas created in the current/previous time period. | - |
| % Total votes delivered chart | The percentage of the cumulative total votes that have been delivered, shown on a monthly interval. | Calculated per month based on the cumulative open/delivered votes delivered up until the last day of the month. Affected by the date picker only in terms of which months are shown - no partial data is shown for the monthly columns (e.g. even if you only select up to the 15th of a previous month, it’ll show the calculation up until the last day of that month). |
| Total votes chart | The cumulative total of open, delivered, and closed votes over time, shown on a daily interval. | Unvotes decrease the cumulative count from the day of the unvote onwards (i.e. the original vote is still counted historically). Ideas that are trashed decrease the cumulative count of votes from the day they are trashed onwards (i.e. the old votes for the idea are still counted historically). Total votes decrease when you merge two ideas where there was a voter in common (from the day of the merge onwards). |
Limitations of the product feedback dashboard
- Currently, ideas that have been merged into other ideas can still gather votes.
- The same idea can be merged into another idea multiple times.
- Ideas that have been delivered or closed also still gather votes.
Check out this idea to disable voting for certain ideation statuses.
Notes for customers with ‘migrated’ ideas
Migrated from the old Digital Hub ideation module?
- The status updates for ideas pre-migration (e.g. moving from open to delivered) are an approximation.
- This is because status change data was not previously stored. As a proxy for when the status was changed, we look at a field called ‘last modified’.
- Pretty much any action taken on a migrated idea will have updated the ‘last modified’ date (e.g. votes, replies, moderator actions).
- If no information is available, then the votes are shown as changing status on the date of your migration.
Migrated from another ideation vendor?
- Ideas created and votes added are shown based on when the idea was originally created and the vote was originally added .
- The date of the status change is the best available guess based on the best information we have (depends on vendor). As a proxy, we used ‘last updated at’.
- If there’s any of the above information missing, then the ideas/votes are shown as being created in their current status on the date of your migration.
Ready to get started?
Learn how to set up the product feedback dashboard step by step: