
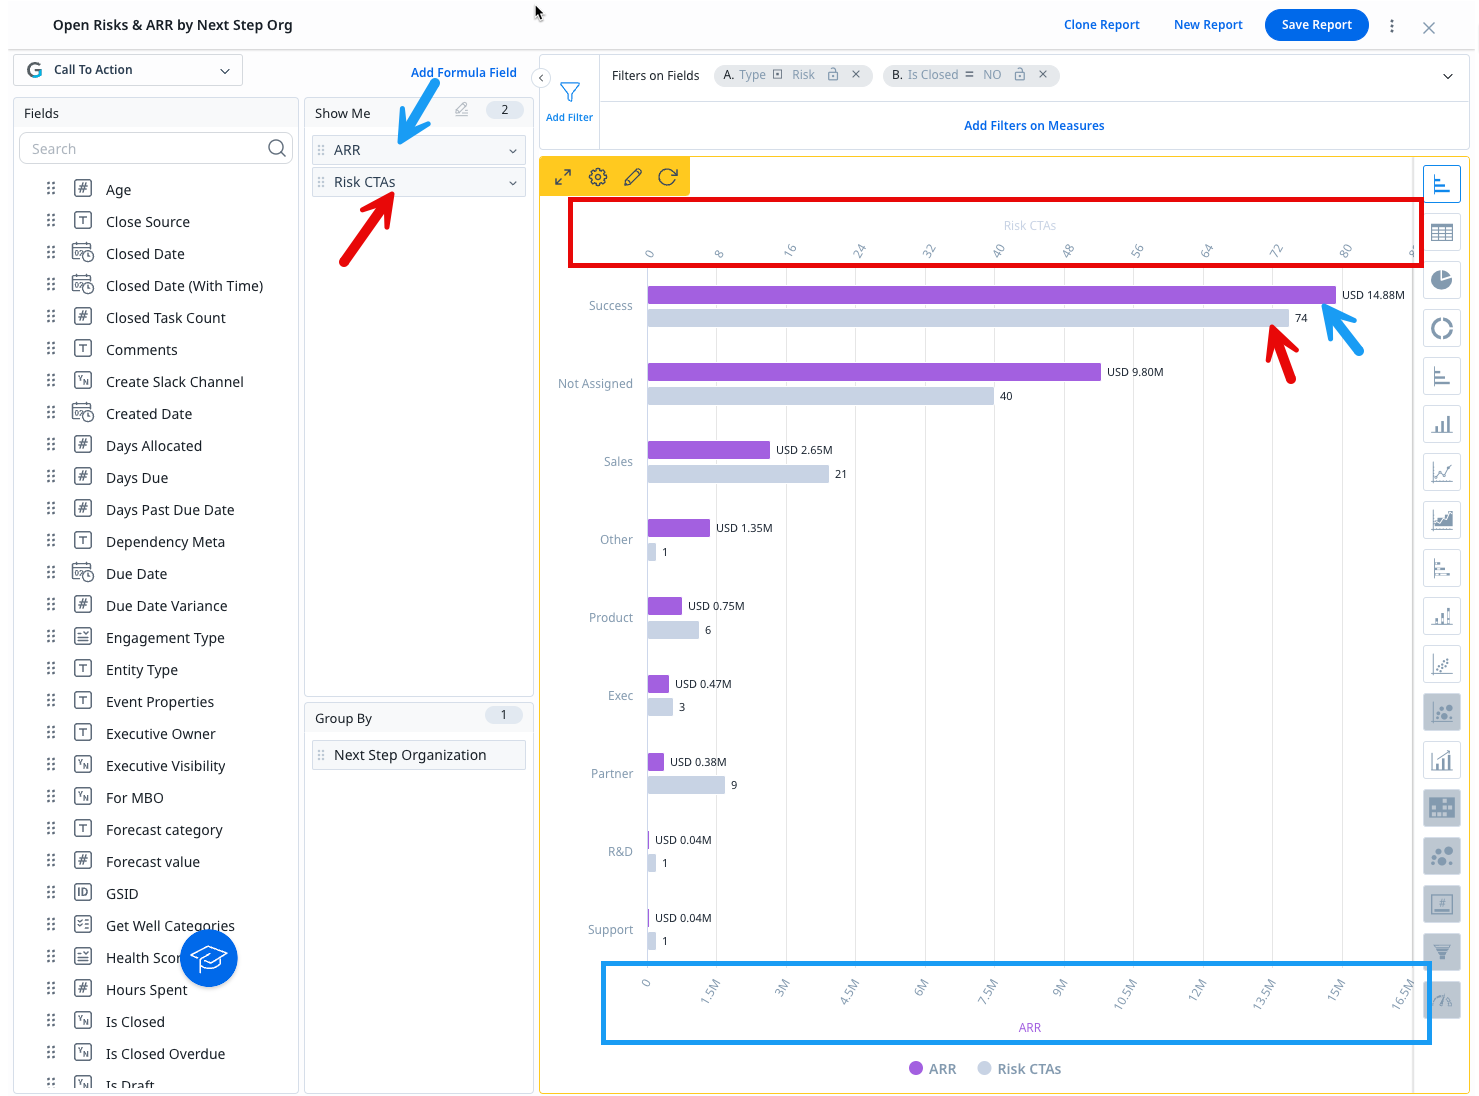
When you have a dual data Source with Horizontal bar graph, the Primary X-Axis (bottom) is the first data source and the Secondary X-Axis (top) is the second data source. However, the top BAR in the displayed data is the first data source, and the bottom bar is the second data source.
For reference, if using a vertical bar graph for the same report, the Primary Y-Axis (left) is the 1st data source, and the Secondary Y-Axis (right) is the second data source, and the bars are 1st data source bar is on the left (next to the correct scale) and the 2nd data source bar is on the right (next to the correct scale).
Recommendation is to SWAP the Primary and Secondary X-Axis Labels to match the order of the displayed data…. Primary on top and Secondary on Bottom when using a Horizontal Bar Graph.