In many cases, we are looking at performance trends and want to be able to show prior period performance within a single widget. Example: I have a KPI widget in a dashboard that shows the number of churned customers for “Last Month”. In that same widget I would like to be able to also show how that performed to the previous month (so a quick snapshot of MoM), OR how that compares to the same month in the previous year. Additionally, if there was an increase or decrease, be able to see that percentage of growth or decline (especially with revenue based values).
Example (using fake data)
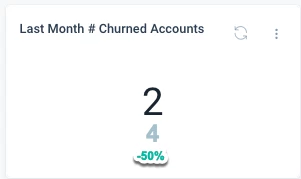
I know we can create graphs that show month over month performance, but visually - these quick snapshots of prior period performance within a single widget are valuable.