
When I have have a guide with 2+ steps/action options, I want to visualize and monitor user actions.
In particular, when a guide offers the ability to Snooze, I want to see what percentage of users snoozed the guide, in order to understand the overall appeal/effectiveness of the guide.
Snooze shows appeal/effectiveness of the engagement, but a mismatch in time/opportunity. For my use cases:
- Product Release Promo - CTA to view release notes, option to snooze
- Snoozing shows they’re interested in / know they should review the release notes, but now’s not the right time.
- NPS or other Surveys - CTA to provide rating, option to snooze
- Snoozing shows they’d like to give feedback, but now’s not the right time.
Understanding that behavior could lead to better ways to optimize the guide. Ex. Is there a better way to trigger it? How often do people snooze before completing?
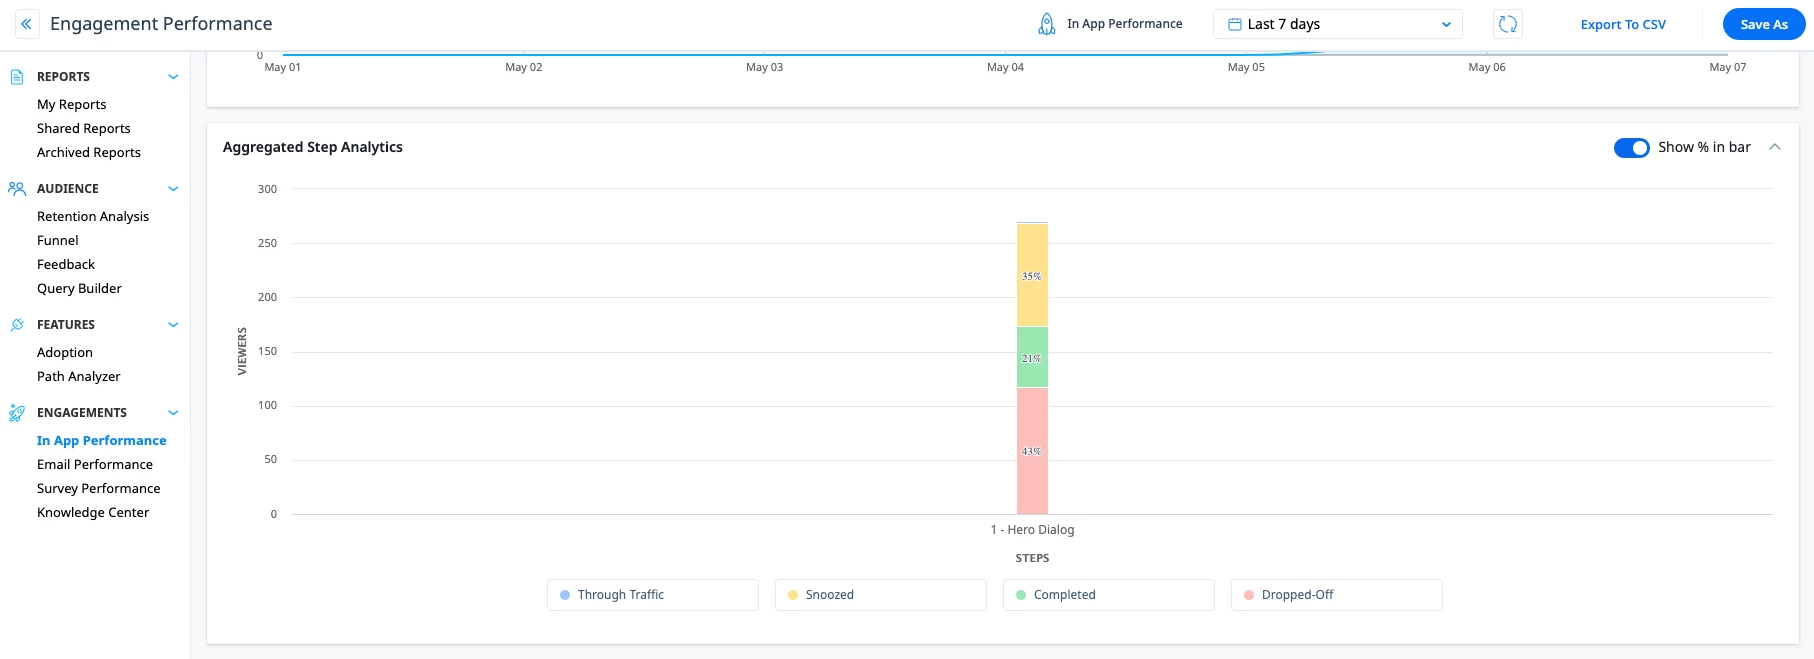
(but as a bar and not a column IMO)
There’s no way to recreate this with the Funnel report or Query Builder, as Snooze events are not usable in those reports for whatever reason.