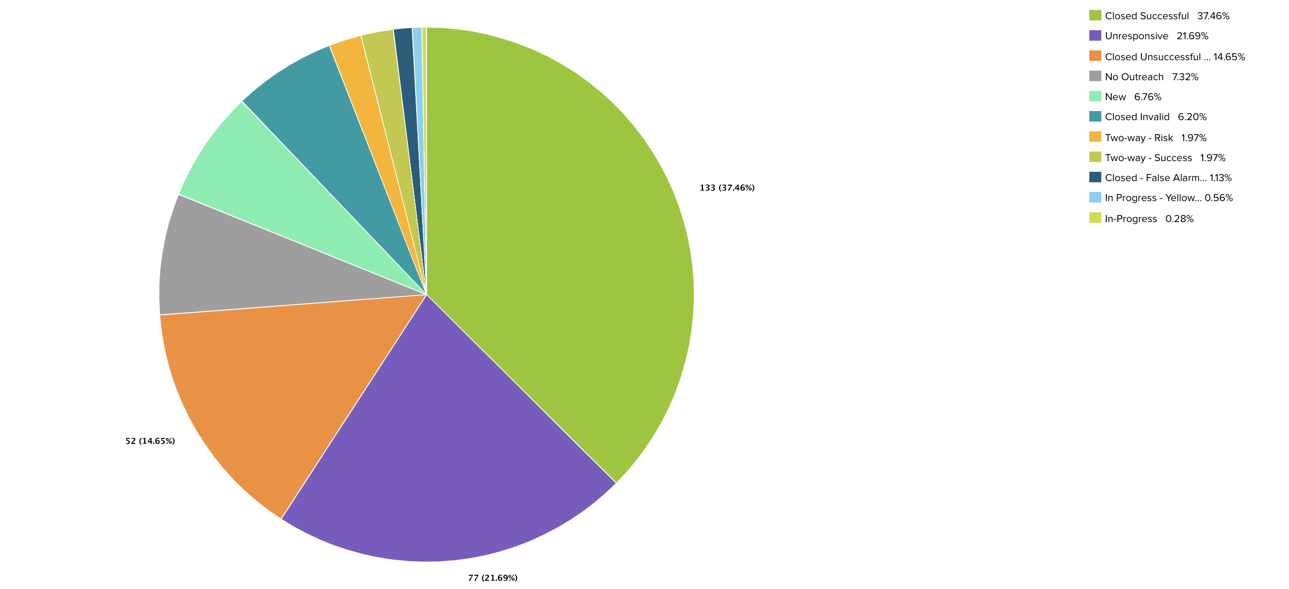
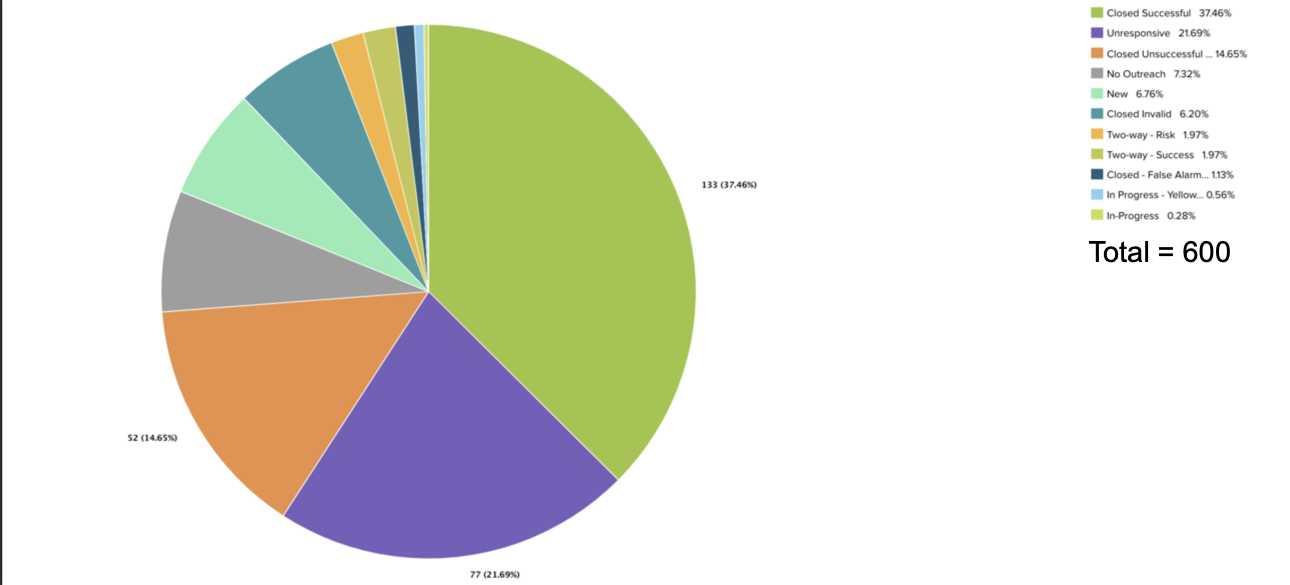
Am I going crazy, or is there not a way to show totals in any of the graph reports in Gainsight? I am not seeing it in any of the options, am I missing something?
If I click show data points, I only get some of the data points in the graph (thats a whole other topic) but how can I see the total number for this pie chart?
My workaround has been to create a widget to show a total and then have a corresponding pie chart. That was working but stakeholders wish we could hit two birds with one stone (sorry PETA) and have one report to show both totals and breakdown.


