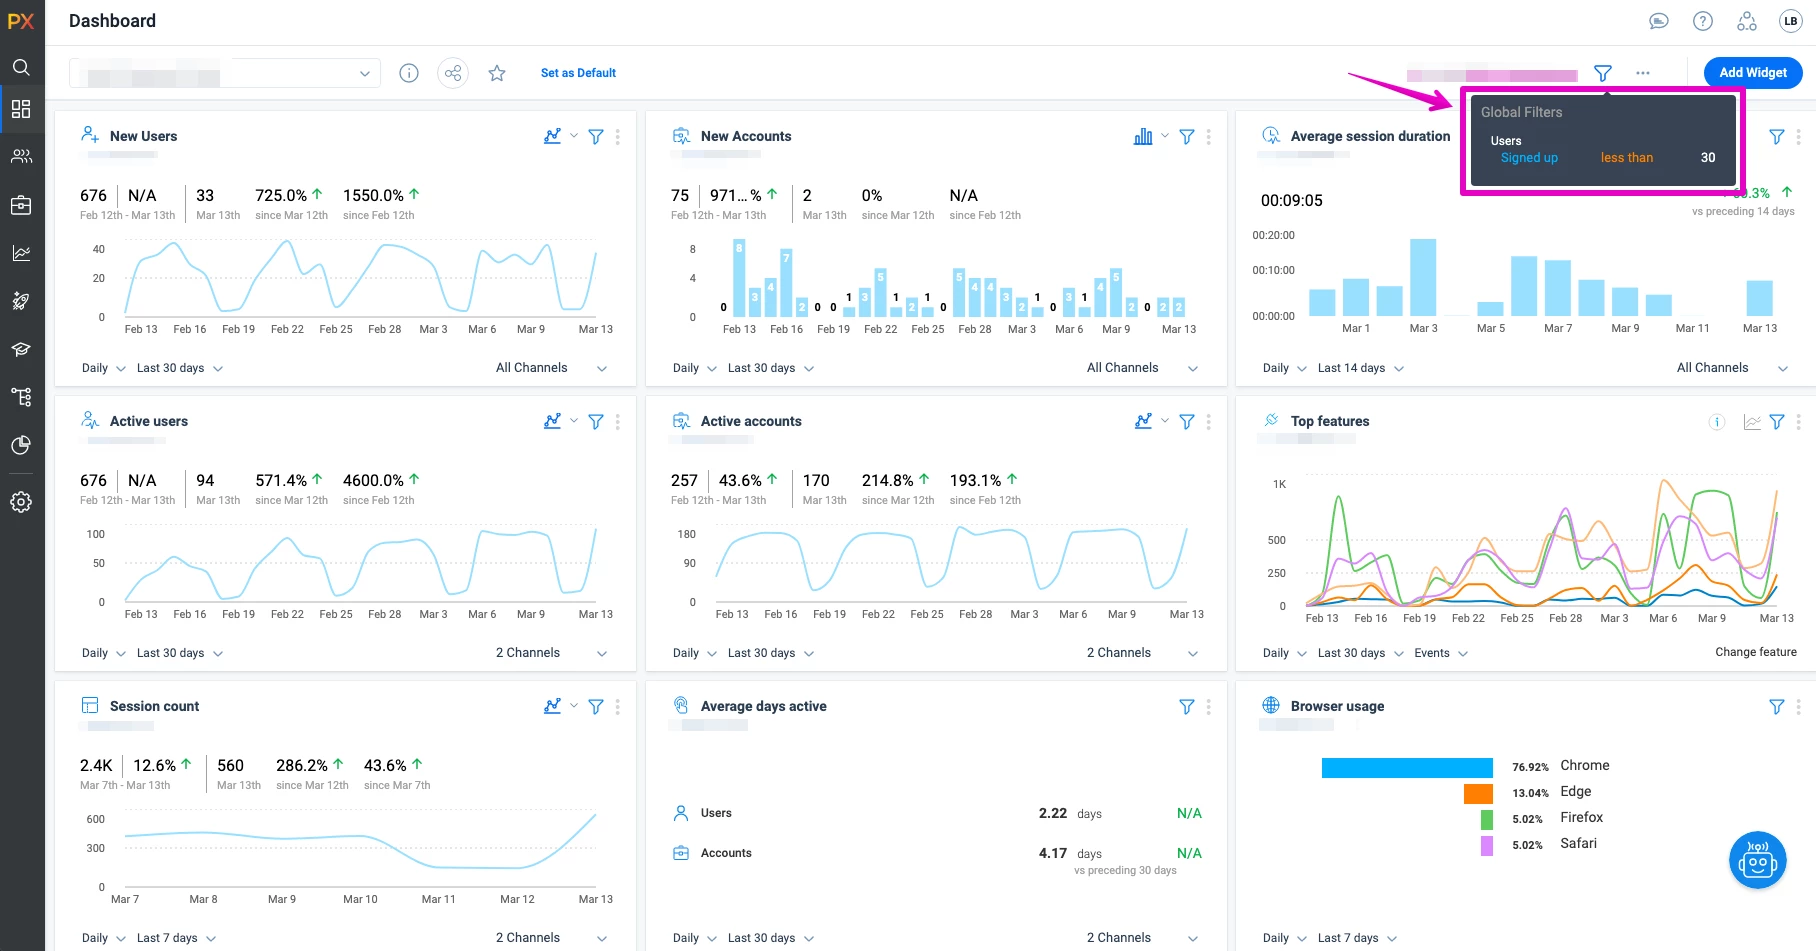
Currently the best place to see signup data over time is within a New User/Account widget on the dashboard. I am trying to dig into this data and do more with it such as export the list of new users. Related business questions would be: How many new users did we have over X time? What role or persona are these users? What brought these users to our platform? Are these users staying in the product?
I think that having a standard “New Adoption Report” in Analytics would be good to filter and tease out specific metrics desired around what new users/accounts are coming in and their use of the product. Could answer some standard questions such as “What features do new users use within the first hour/week/month?”
Second is adding the event type “Sign Up” to the Query Builder would allow manual setup of the desired details.
Current workaround is to use the Audience Explorer to filter for Sign Up Between X and Y to simply recreate the dashboard widget count, and this does allow us to export the list of users.


