
This article helps community managers understand the KPI widgets under the Audience Dashboard.
Overview
The Audience dashboard is a robust analytics dashboard designed to provide a detailed understanding of visitor traffic and user engagement across your digital platform. By leveraging a rich set of Key Performance Indicators (KPIs) and customizable date filters, the dashboard empowers product owners, marketers, and analysts to monitor audience behavior, identify trends, and measure reach effectively.
Through core metrics such as unique visitors, page views, and visitor types (registered vs. guest), the dashboard delivers a comprehensive view of audience composition and interaction patterns. Change indicators highlight shifts in performance across periods, helping teams detect emerging trends and assess the impact of campaigns or content updates.
Additionally, the dashboard breaks down engagement by visitor type, enabling targeted strategies for user acquisition and retention. With visualized daily activity and comparative growth insights, it serves as a critical tool for evaluating digital reach and optimizing the user journey.
Access and Manage Audience Dashboard
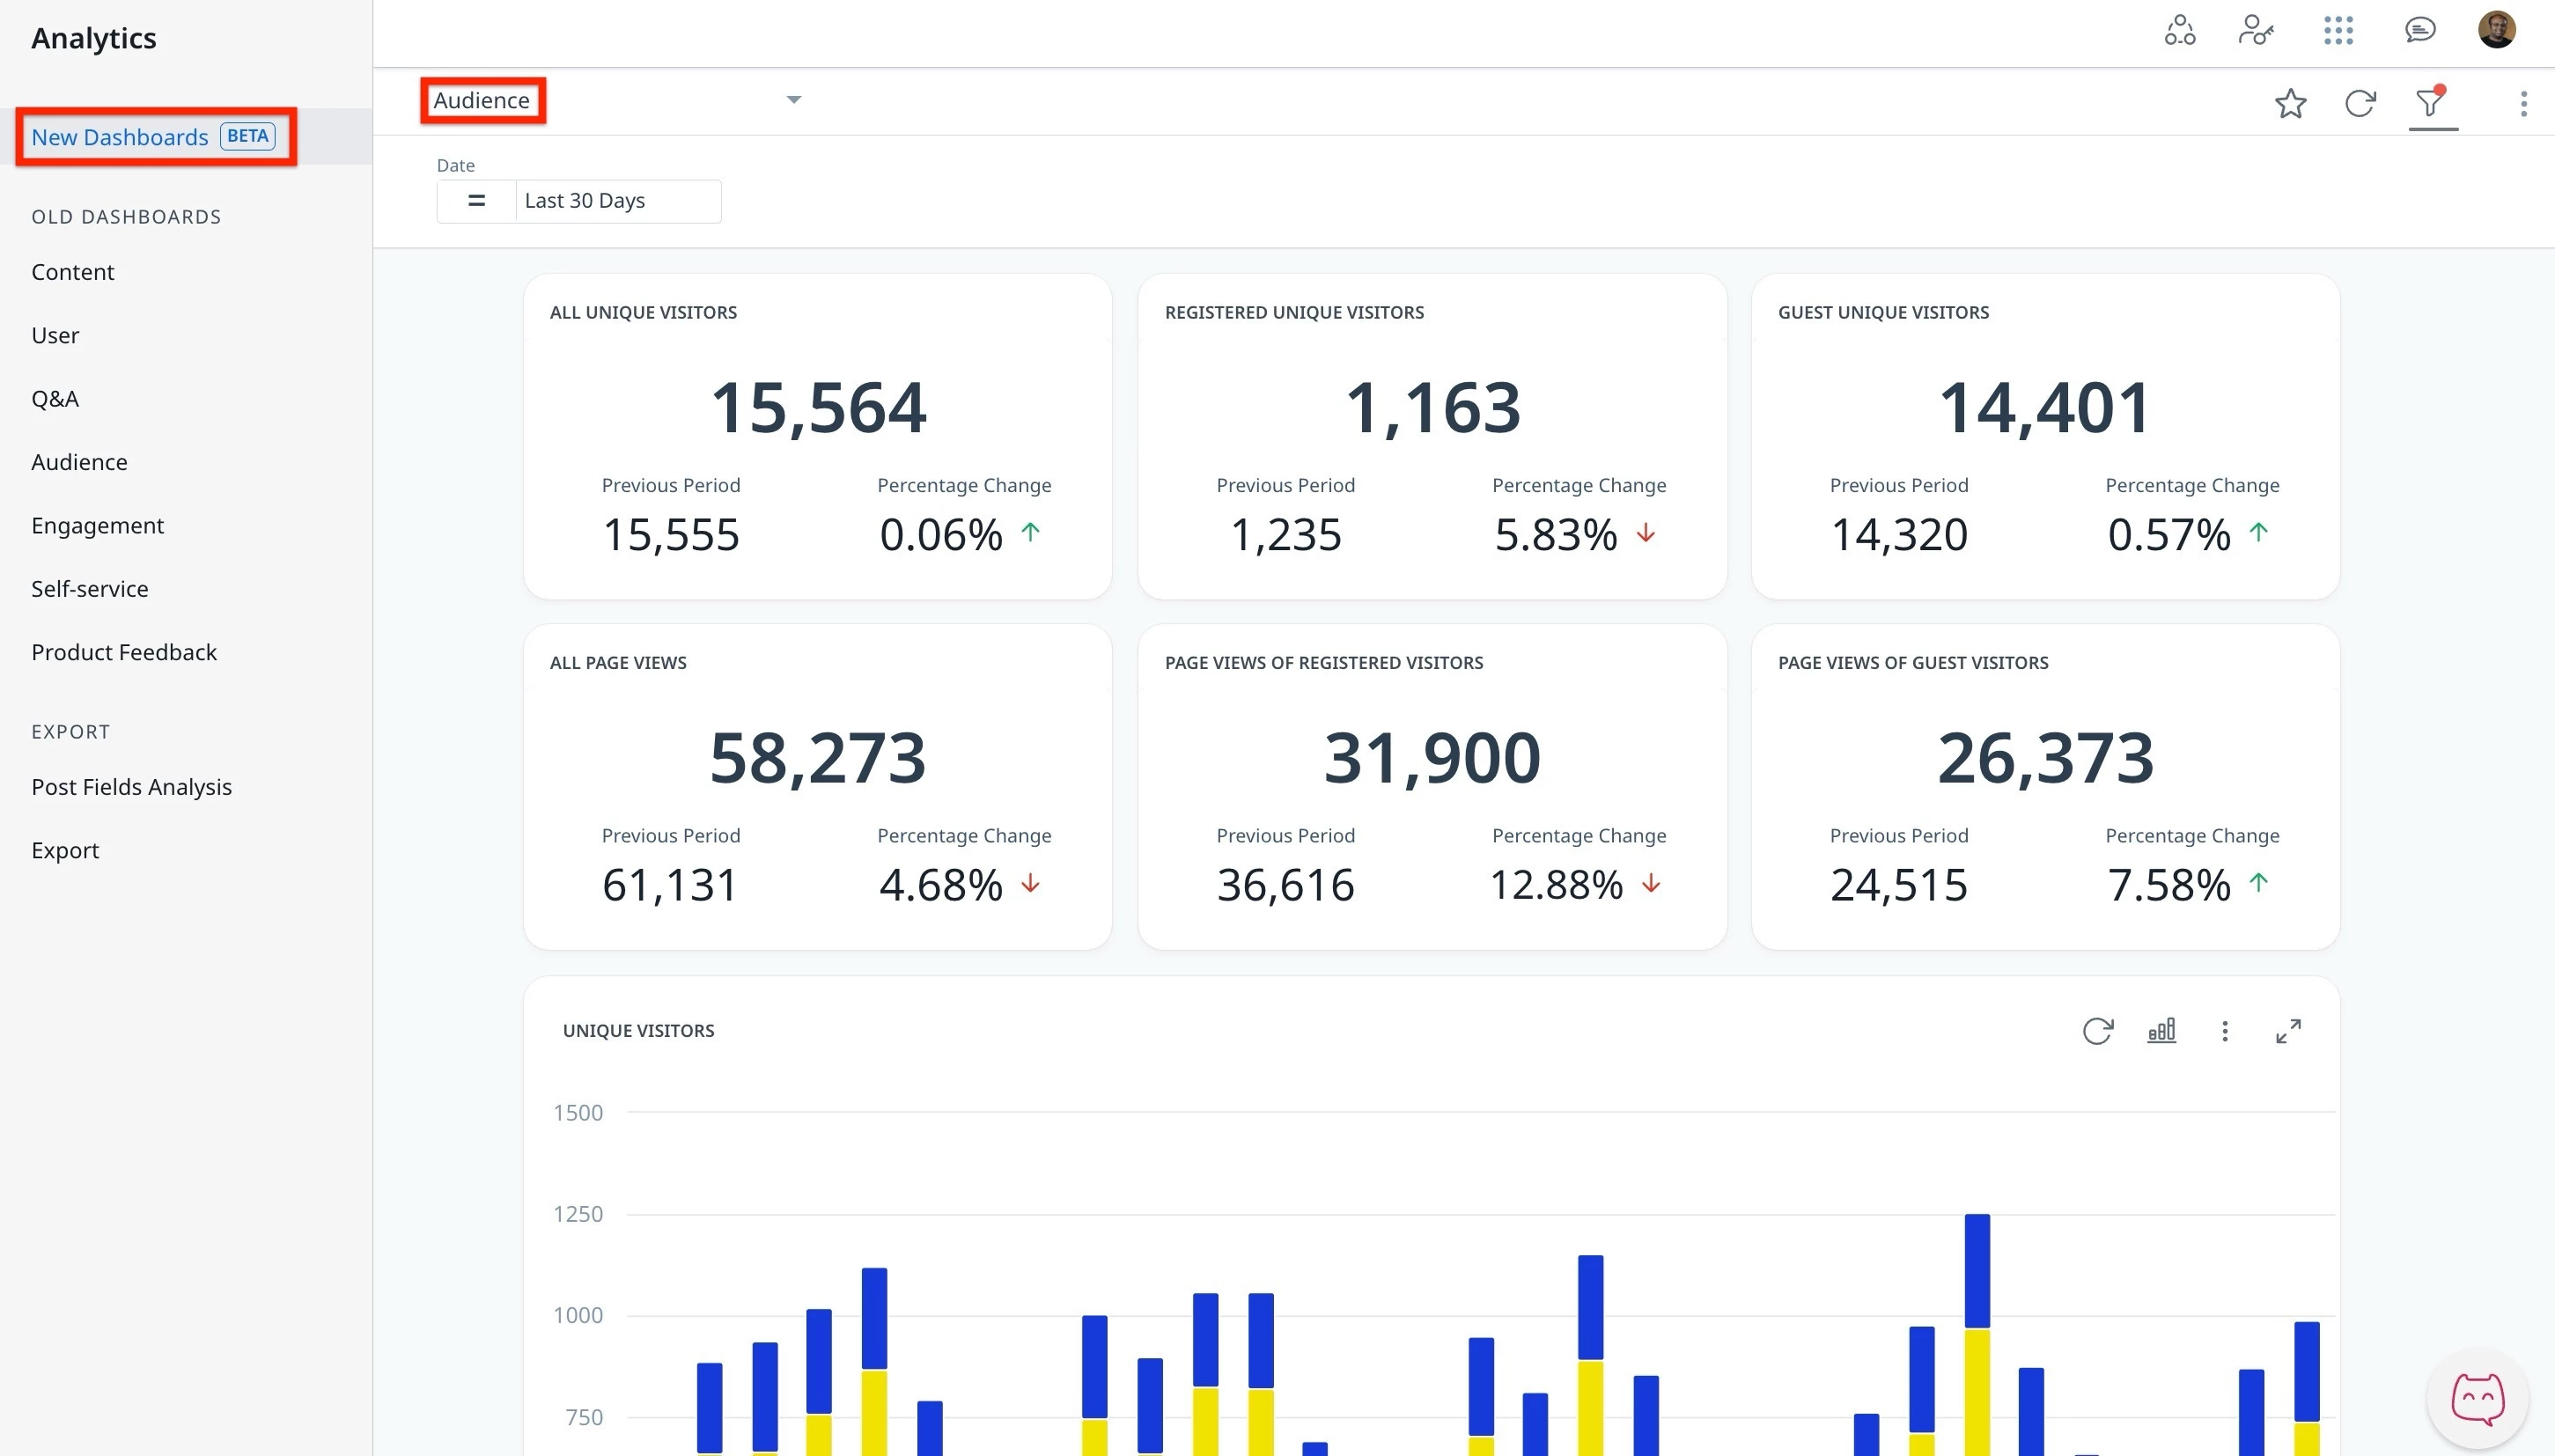
The Audience dashboard is an out-of-the-box (OOB) dashboard that can be viewed from the Analytics page.
To view the Dashboard:
- Log in to Control.
- Navigate to Analytics > New Dashboards.
- From the dropdown list, select Audience dashboard. The Audience dashboard appears.
Note: The dashboard data is displayed in UTC.
For more information on how to customize Dashboards and Widgets, refer to the Customize New Dashboards article.
Understand the Key Performance Indicators
To effectively use the Audience dashboard and accurately interpret performance insights, it is important to first understand the key performance indicators it tracks. The KPIs in the Audience dashboard help track user engagement, page views, and audience reach.
% Period to Period Change and Previous Period
Users are equipped to understand performance shifts through the % Period to Period Change and Previous Period metric, which provides a clear comparison over matching timeframes.
% Period to Period Change
This metric shows how a Key Performance Indicator has increased or decreased over time. It compares two time periods of the same length to give a fair and clear view of performance changes. For example, if you select the last 15 days, it compares them to the 15 days right before that.
Previous Period
The previous period is always the same number of days as the period you choose. If you select April (30 days), the system looks at the 30 days just before April, not the full month of March. This helps make sure the comparison is even and accurate.
The following table describes each KPI available in the Audience dashboard:
| KPIs | Description |
| All Unique visitors | The total number of unique visitors to the community within the selected timeframe, identified by tracking cookie. |
| Registered unique users | The number of registered unique visitors to the community within the selected timeframe, identified by user ID. Visits from different devices are counted as one unique visitor. |
| Guest unique visitors | The number of guest visitors to the community within the selected timeframe, identified by tracking cookie. Visits from different devices are counted as separate, unique visitors. A unique visitor is better technically defined as a unique device. |
| All page views | The total number of community pages loaded or reloaded in the selected timeframe. |
| Page views of registered visitors | The total number of community pages loaded or reloaded in the selected timeframe by logged-in visitors. |
| Page views of guest visitors | The total number of community pages loaded or reloaded in the selected timeframe by anonymous visitors. |
Note: If you want to calculate these KPIs using data from the CC Data Lake, refer to the Audience Dashboard KPIs – Query Reference for CC Data Lake article.
How Page Views are Assigned to Registered Users Over Time
Page views of users who are not registered are tracked using a cookie. When a user logs in or registers, we match their tracking cookie to their user ID. Once this link is made, Gainsight retroactively attributes their past guest page views to their registered profile. As a result, the number of guest visitors may decrease over time, while the number of registered user views increases.
