
This article helps admins understand the KPI widgets under the Q&A Dashboard.
Overview
The Question-and-Answer (Q&A) dashboard is a powerful tool for community admins to analyze Q&A interactions within the community. It provides visibility into how questions are asked and answered, by whom, and reveals trends in engagement, support effectiveness, and user contributions.
By utilizing the ability to filter both by question authors and answer authors, the dashboard offers clear visibility into the engagement levels of community members compared to company employees. You can also filter by custom roles to identify which users are actively providing support and determine the percentage of answers contributed by non-employees. This helps measure how much of the community support originates from peers rather than staff. A high level of peer-to-peer support reflects strong community engagement and can reduce support costs by shifting some of the workload away from internal teams.
Key Features:
This dashboard helps you:
- Monitor the volume of community questions and answers.
- Evaluate engagements by role, identifying gaps in participation.
- Track average response times for continuous support improvement.
- Apply granular filters to uncover trends specific to user roles and content categories.
Global Filters
To support targeted analysis, the dashboard provides the following global filters:
- Activity Date: Applies to the creation date of the question and the creation date of the reply that was marked as the Best Answer, regardless of when the question was answered or when the reply was marked as best.
-
Published In: The Published in filter applies to the most recent category or group update. If the content has been moved between categories over time, only the last or current category is considered.
- Group Filter: Focuses on content that is shared within groups, for example, Beta Groups. It applies to the most recent group update. If the content has been moved between groups over time, only the last or current group is considered.
- User Primary role question: Assesses contributions based on primary user role. The filters apply to the most recent role update. If the author's user role has changed over time, only the last or current role is taken into account.
- User Primary role answers: Assesses contributions based on the primary user role. The filters apply to the most recent role update. If the author's user role has changed over time, only the last or current role is taken into account.
- User Custom role question: Assesses contributions based on custom user role. The filters apply to the most recent role update. If the author's user role has changed over time, only the last or current role is taken into account.
- User Custom role answers: Assesses contributions based on the custom user role. The filters apply to the most recent role update. If the author's user role has changed over time, only the last or current role is taken into account.
Note: For User role filters:
- Primary and Custom roles work with AND logic applied between them.
- Multi-select options in the Custom role use OR logic.
- “Is one of” or “Is not one of” filters to exclude users with given primary and or custom roles.
Access and Manage Q&A Dashboard
The Q&A dashboard is an out-of-the-box (OOB) dashboard that can be viewed from the Analytics page.
To view the Dashboard:
- Log in to Control.
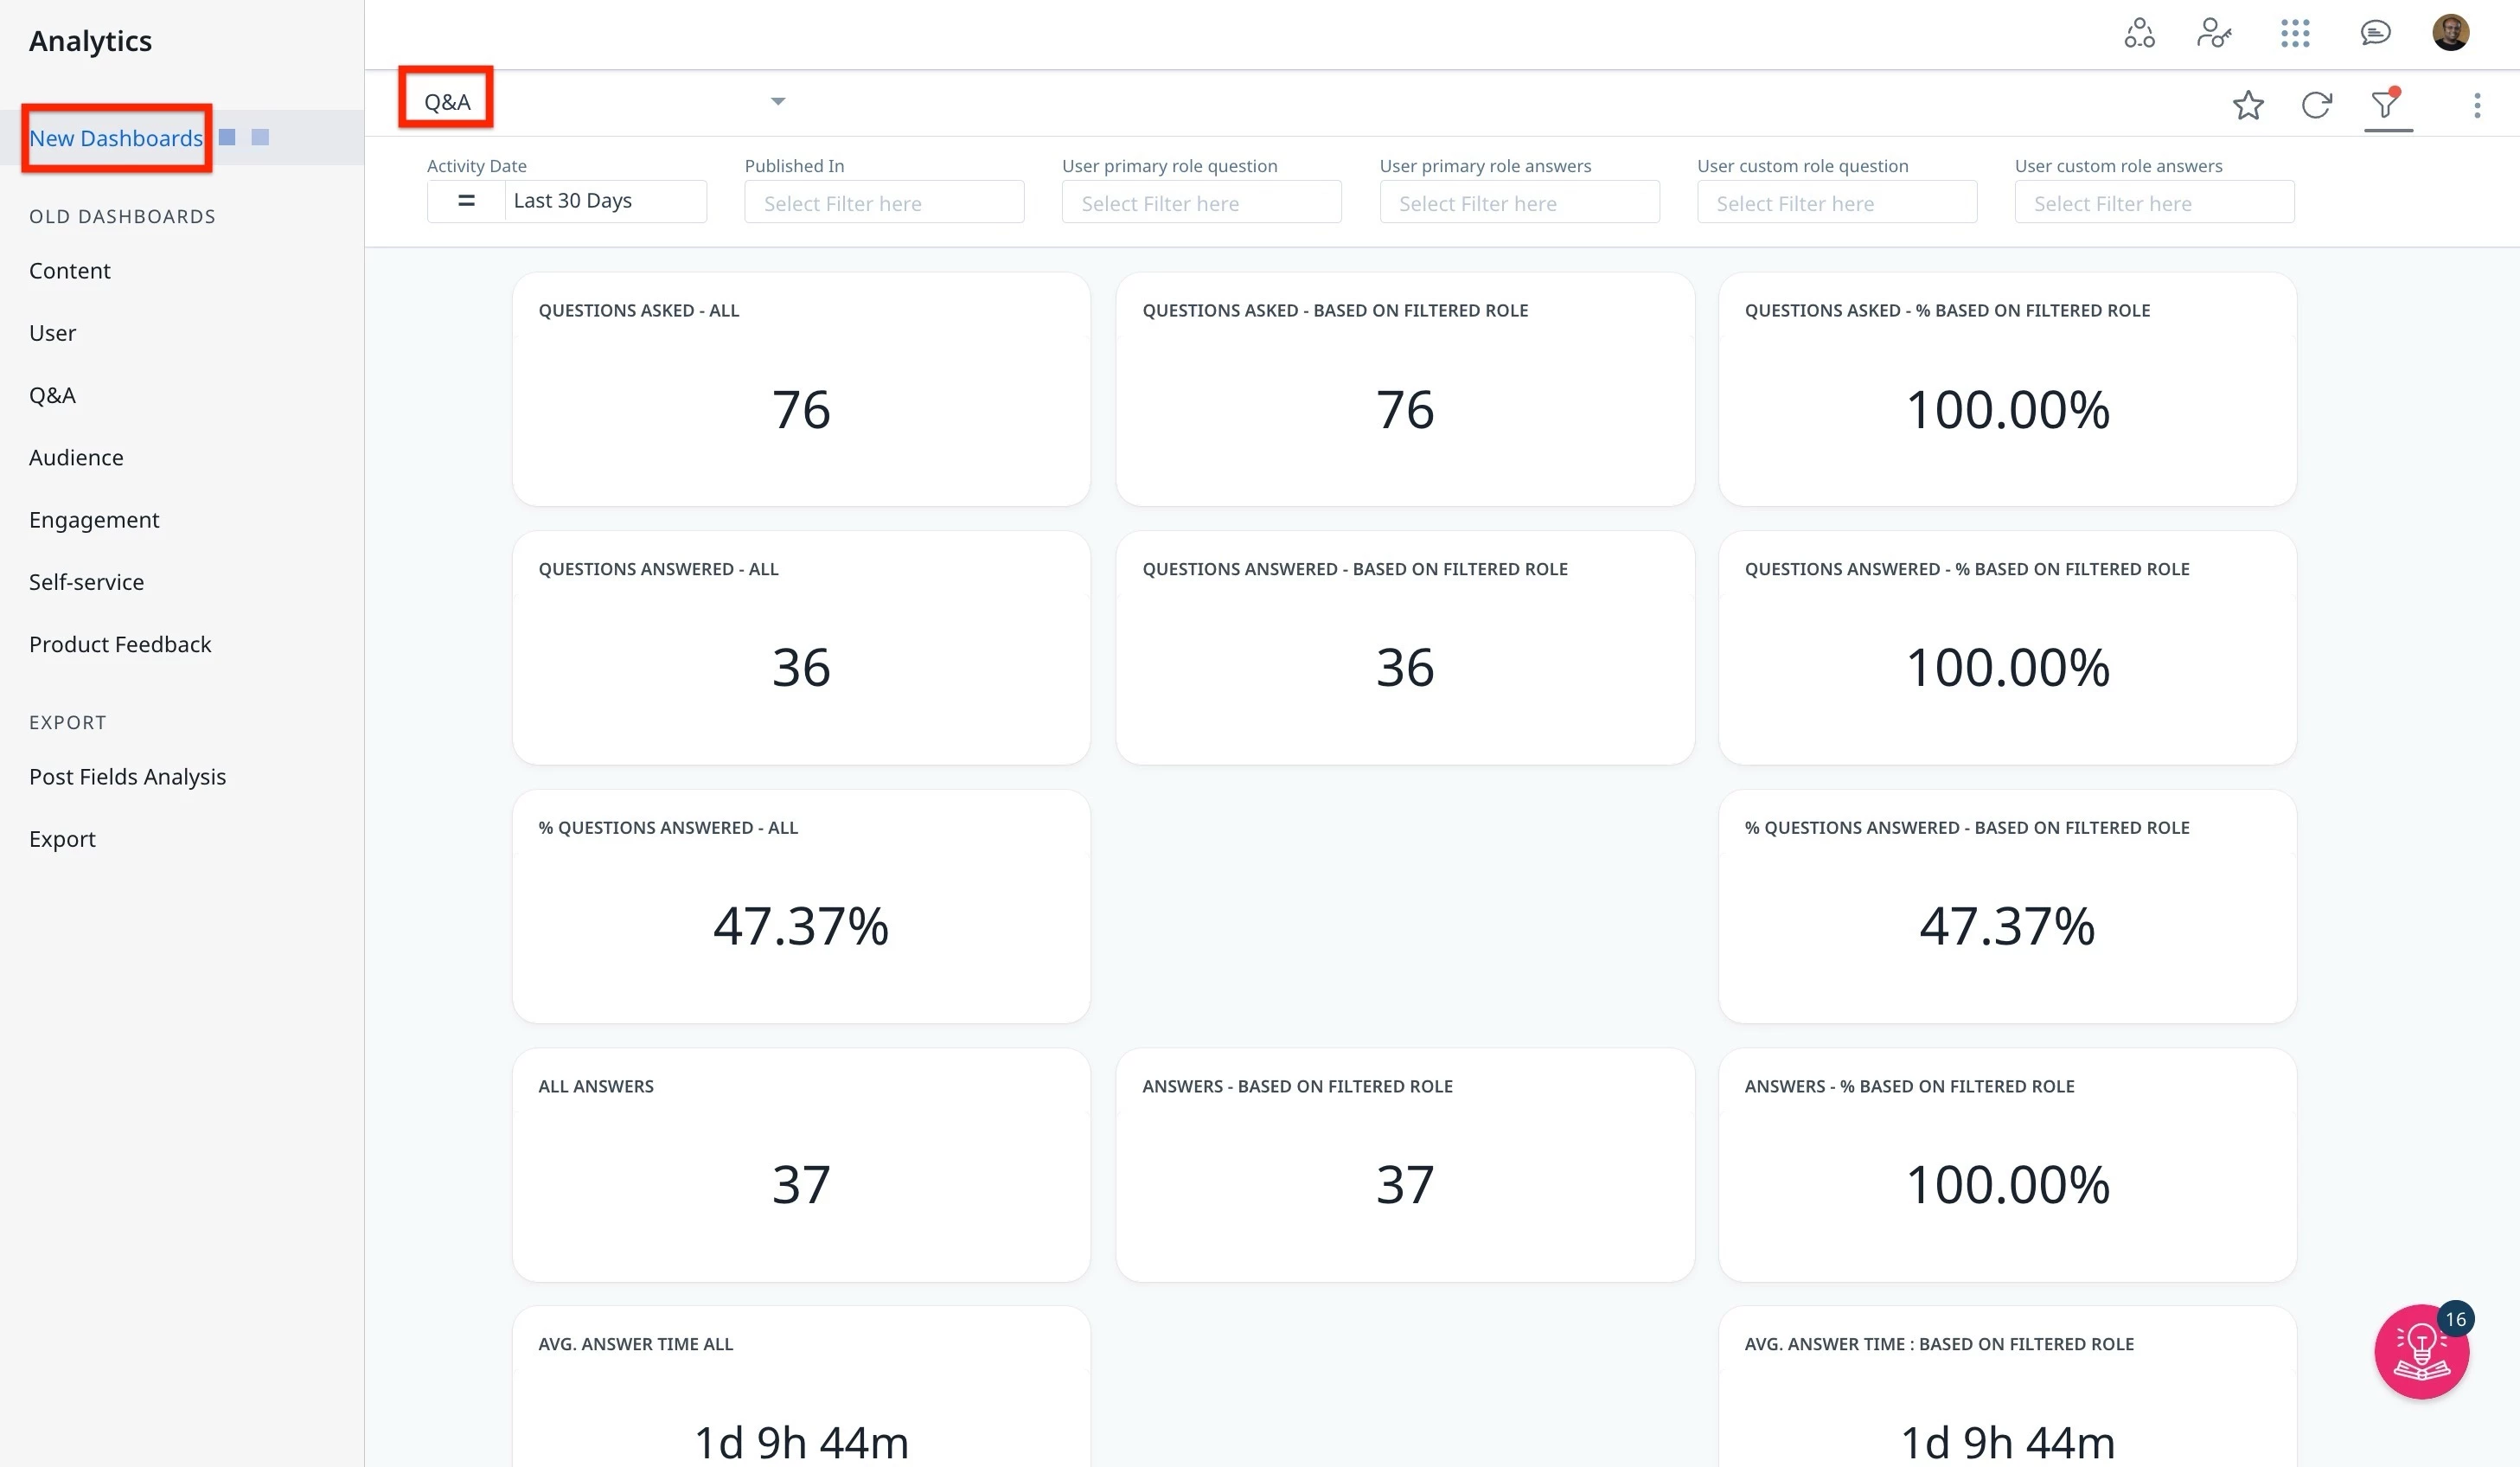
- Navigate to Analytics > New Dashboards.
- From the dropdown list, select Q&A Dashboard. The Q&A dashboard appears.
Admins can interact and customize the dashboard using features such as global and individual filters.
Note: The dashboard data is displayed in UTC.
For more information on how to customize Dashboards and Widgets, refer to the Customize New Dashboards article.
Understand the Key Performance Indicators
Understanding Key Performance Indicators (KPIs) in the Q&A Dashboard is essential for evaluating how effectively your community is managing and responding to questions. These KPIs provide measurable insights into questions asked and answered, and average answered time.
By tracking both the volume and quality of questions and answers along with contributor roles, community admins can identify strengths, uncover gaps, and drive targeted improvements in engagement and support efficiency.
The Q&A Dashboard KPI widgets are divided into three sections:
Questions
This section focuses on when questions were asked, not when they were answered. This is important for understanding current answer rates and backlog trends.
Common Exclusions: Spam, trashed, and deleted topics are excluded.
| KPIs | Description | Fitler Exceptions and Note |
|---|---|---|
| All Questions Asked | Total number of questions asked during the selected date range. | Filter Exceptions: The user (primary and custom question and answer) role filters do not apply to this KPI. |
| Questions Asked (Based on Filtered Role) | Number of questions asked by users with selected roles (using User Role Question filter). | Filter Exceptions: The user (primary and custom answer) role filters do not apply to this KPI. |
| Questions Asked ( % Based on Filtered Role) | What percentage of total questions were asked by filtered roles. (Formula: Filtered Questions / All Questions × 100) | Filter Exceptions: The user (primary and custom answer) role filters do not apply to this KPI. |
| All Questions Answered | Number of questions that received an answer within the date range. | Filter Exceptions: The user (primary and custom question and answer) role filters do not apply to this KPI. |
| Questions Answered (Based on Filtered Role) | Count of answered questions where both the asker and responder meet the selected role filters. | |
| Questions Answered ( % Based on Filtered Role) | The percentage of answered questions meets both the asker and responder role filters. | |
| % All Questions Answered | Overall percentage of answered questions. (Formula: Answered Questions / All Questions × 100) | Filter Exceptions: The user (primary and custom question and answer) role filters do not apply to this KPI. |
| % Questions Answered (Based on Filtered Role) | Percent of questions asked by a filtered role that were answered by a filtered role. (Formula: Filtered Answered / Filtered Asked × 100) |
Answers
This section evaluates when answers were given, regardless of when the questions were asked. Only replies marked as Best Answers are included.
Common Exclusions: Spam, trashed, and deleted replies are excluded.
| KPIs | Descriptions | Filter Exceptions and Note |
|---|---|---|
| All Answers | Total best answers posted during the selected timeframe. | Filter Exceptions: The user (primary and custom question and answer) role filters do not apply to this KPI. |
| Answers (Based on Filtered Role) | Answers authored by users with selected roles (User Role Answer filter). | |
| Answers (% Based on Filtered Role) | What share of answers came from filtered roles. (Formula: Filtered Answers / All Answers × 100) |
Average Answer Time
This measures the time between when a question was asked and when it received the best answer. It does not consider when the answer was marked as best, only when it was posted.
| KPIs | Description |
|---|---|
| Avg. Answer Time All | Overall average time to receive the best answer. Filter Exception: The user (primary and custom question and answer) role filters do not apply to this KPI. |
| Avg. Answer Time ( Based on Filtered Role) | Average time to answer by selected roles (User Role Answer filter). |
Note: If you want to calculate these KPIs using data from the CC Data Lake, refer to the Q&A Dashboard KPIs – Query Reference for CC Data Lake article.