
This article helps community managers understand the KPI widgets under the User dashboard.
Overview
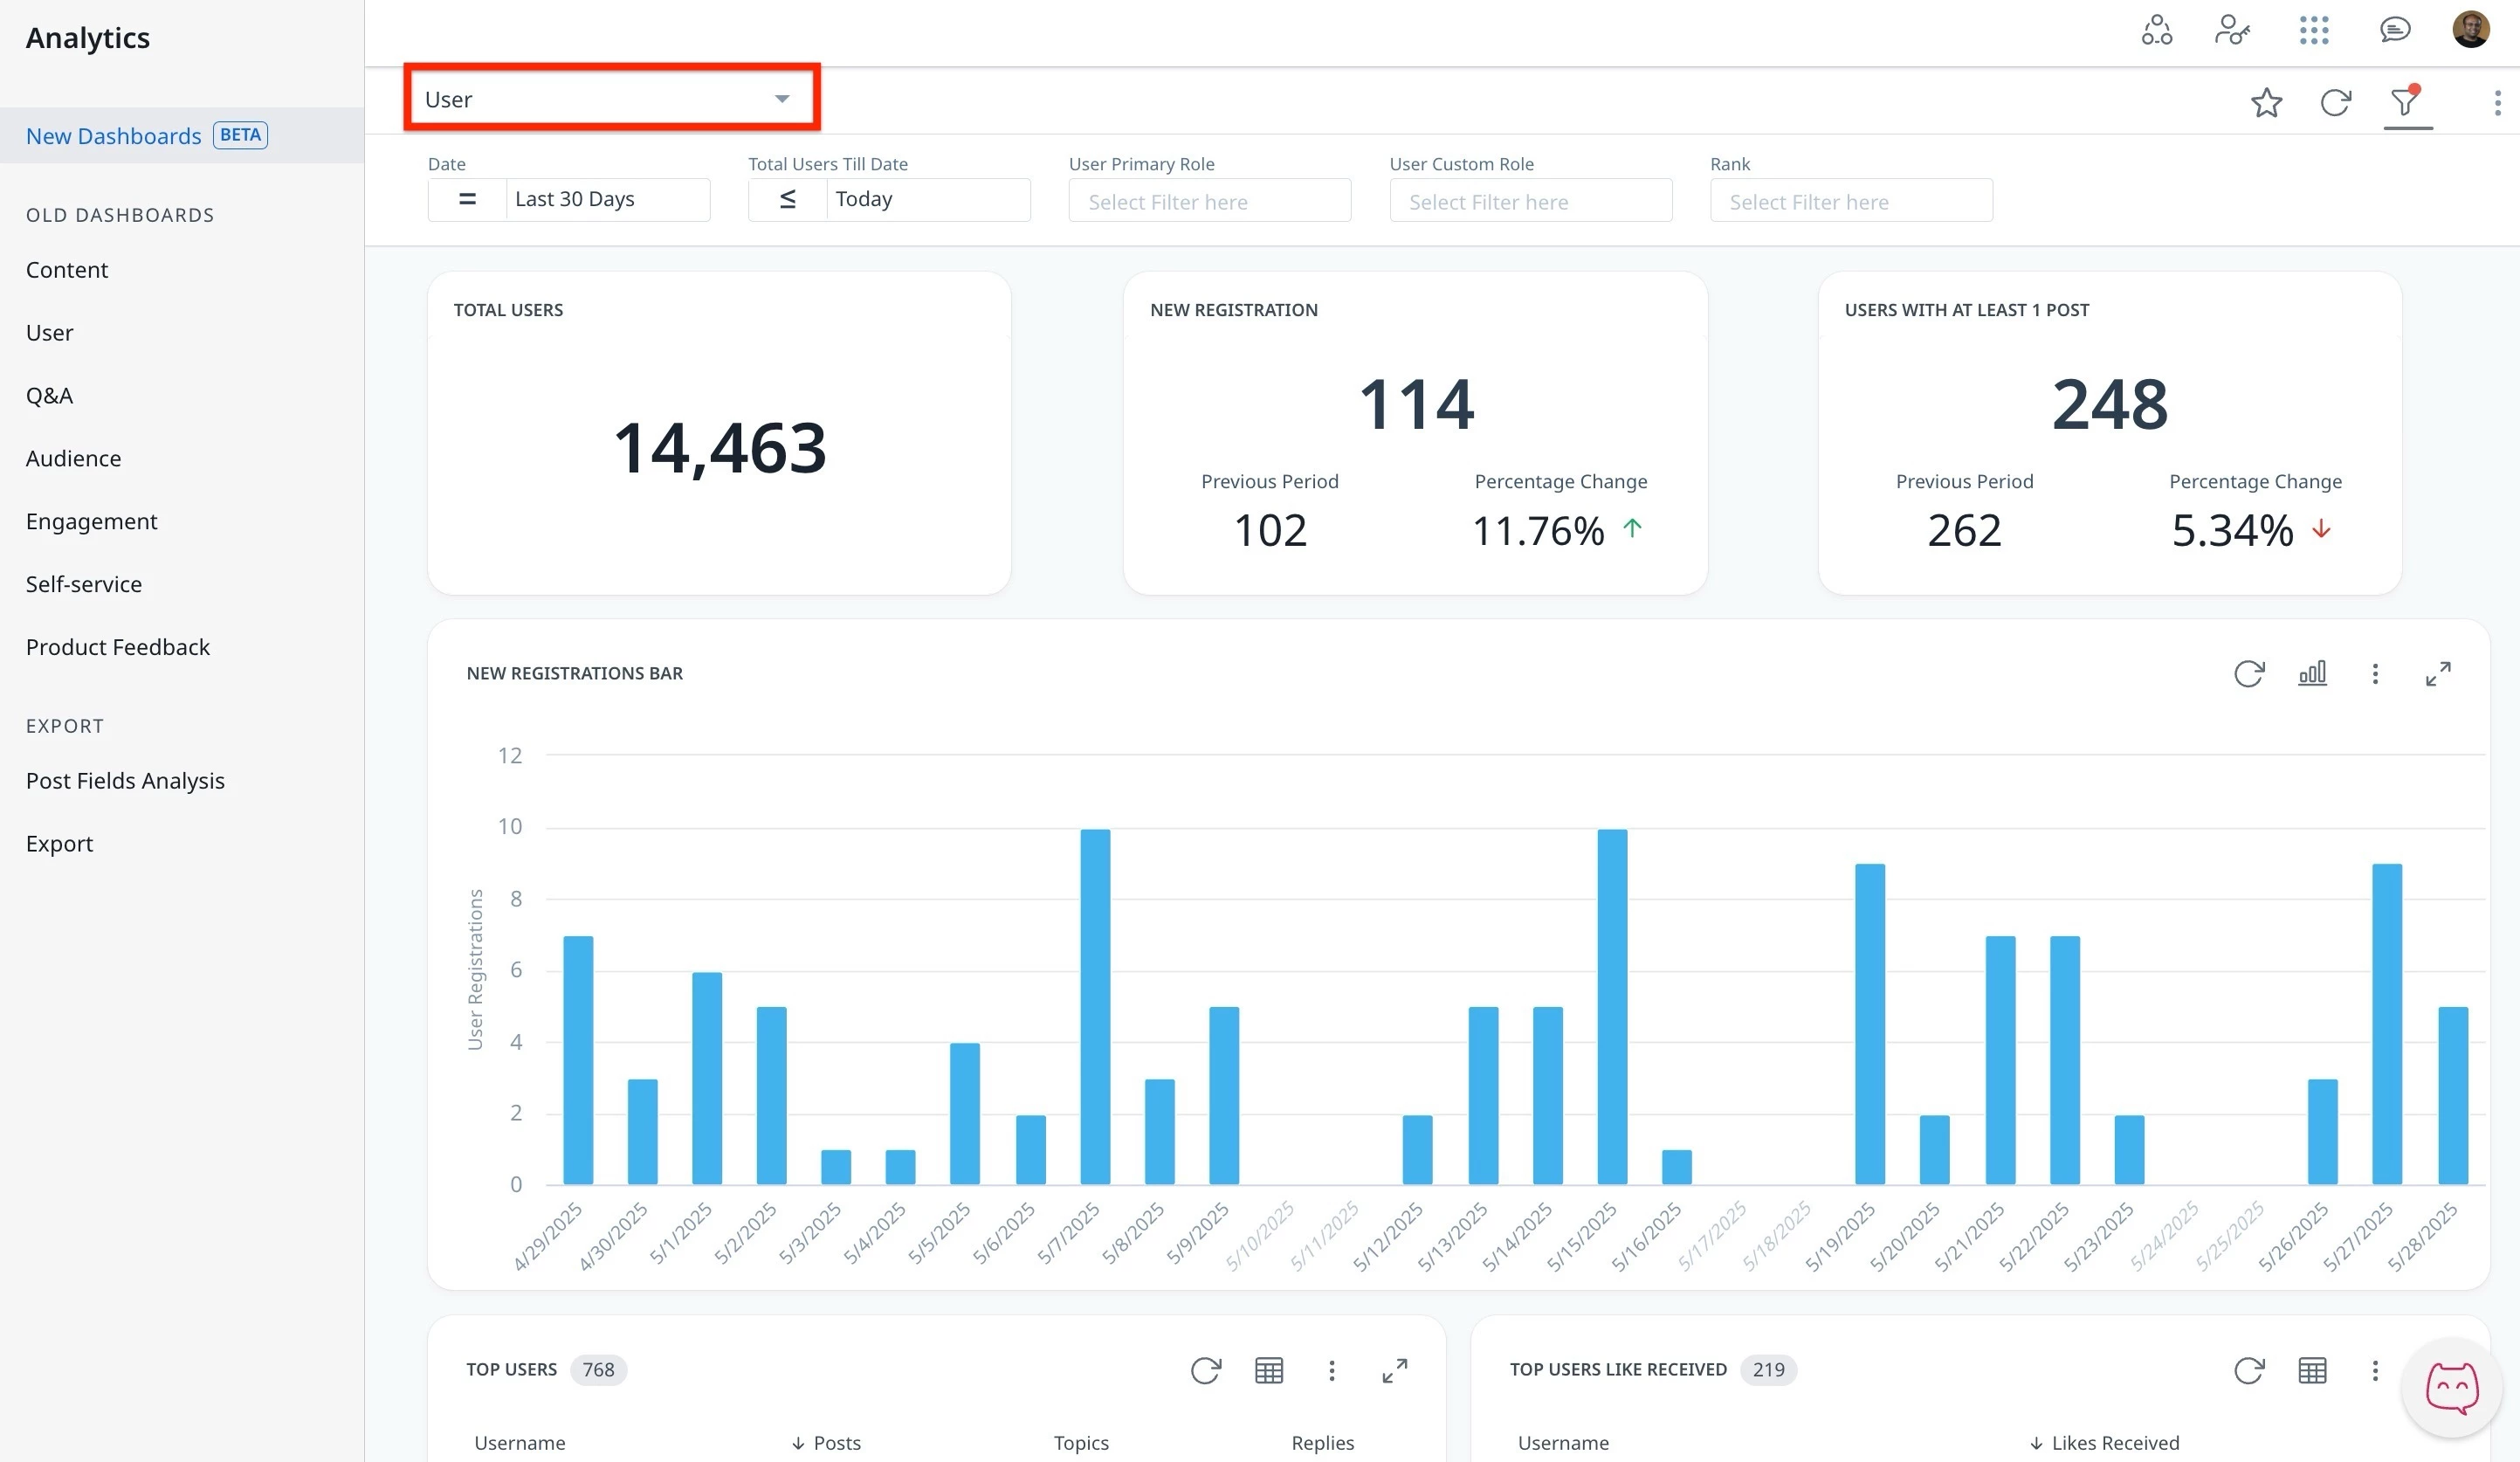
The User dashboard is a powerful analytics dashboard that delivers in-depth insights into community member activity and engagement. Tailored for community managers, product teams, and engagement analysts, it combines a set of key performance indicators (KPIs) with flexible filter options to track user growth, participation trends, and interaction levels over time.
Core metrics such as total users, new registrations, and users with at least one post offer a comprehensive snapshot of community health and user contribution. Percentage change indicators highlight performance trends between selected periods, enabling quick assessments of growth or decline in user registration.
In addition to high-level KPIs, the dashboard includes detailed leaderboards showcasing top users, which can be sorted by various criteria such as the number of posts, topics, replies, likes given and received, answers provided, and gamification points earned—all within a specified time frame. This comprehensive breakdown enhances recognition strategies, content planning, and user retention initiatives by pinpointing the most active and influential users.
By consolidating user behavior metrics into an interactive and filterable view, the User dashboard empowers teams to evaluate community dynamics, optimize participation strategies, and foster sustained engagement within the platform.
Global Filters
To support targeted analysis, the dashboard provides the following global filters:
- Date Filter: Applies to user activity within the selected date range, such as when a user joined the community, posted content (questions, ideas, conversations, replies, or answers), gave or received likes, or earned points.
- Total Users Till Date: This filter spans from the community's inception to the end of the selected time.
- User Primary Role: Assesses contributions based on primary user role. It applies to the most recent role update. If the author's user role has changed over time, only the last or current role is taken into account.
- User Custom Role: Assesses contributions based on custom user roles. It applies to the most recent role update. If the author's user role has changed over time, only the last or current role is taken into account.
- Rank: This filter applies to the most recent rank update. If the rank has changed over time, only the last or current content type is considered.
Access and Manage User Dashboard
The User dashboard is an out-of-the-box (OOB) dashboard that can be viewed from the Analytics page.
To view the Dashboard:
- Log in to Control.
- Navigate to Analytics > New Dashboards.
- From the dropdown list, select Audience dashboard. The Audience dashboard appears.
Admins can interact and customize the dashboard using features such as global and individual filters, report visualization options, and more.
Note: The dashboard data is displayed in UTC.
For more information on how to customize Dashboards, Widgets, and Reports, refer to the Customize New Dashboards article.
Understand the Key Performance Indicators
To effectively use the User dashboard and accurately interpret performance insights, it is important to first understand the key performance indicators it tracks. The KPIs in the User dashboard help track total users, new registrations, and users with at least one post, and top users tables, which can be sorted by various criteria.
% Period to Period Change and Previous Period
Users are equipped to understand performance shifts through the % Period to Period Change and Previous Period metric, which provides a clear comparison over matching timeframes.
% Period to Period Change
This metric shows how a Key Performance Indicator has increased or decreased over time. It compares two time periods of the same length to give a fair and clear view of performance changes. For example, if you select the last 15 days, it compares them to the 15 days right before that.
Previous Period
The previous period is always the same number of days as the time period you choose. If you select April (30 days), the system looks at the 30 days just before April, not the full month of March. This helps make sure the comparison is even and accurate.
Common Exclusions
The following user types and content are excluded from all KPI calculations unless otherwise noted:
- Users with specific roles
- Banned
- Deleted
- Guest users
- Users requiring approval
- Users who have not activated their accounts
- Super admins
- Topics, Replies, and Posts
- Spam, trashed, and deleted topics and replies.
- Content from categories that have the exclude from user statistics option enabled.
- Likes given to spam, trashed, or deleted posts.
- If a user unlikes a topic or reply, the count goes down
- Unmarked answers reduce the count in answer-based KPIs
| KPIs | Descriptions | Filter Exceptions and Notes |
|---|---|---|
| Total Users | Displays the total number of valid, registered users in the community up to the selected end date in Total Users Till Date filter. | Filter Exceptions: The Date filter does not apply to this KPI. |
| New registrations | Shows the number of users who joined the community within the selected date range. | Filter Exceptions: The Total Users Till Date filter does not apply to this KPI. |
| Users with at least one post | Counts users who have created at least one topic or reply during the selected period. | Filter Exceptions: The Total Users Till Date filter does not apply to this KPI. |
| Top Users | Posts (by user) The number of topics and replies created by a user in the selected time. | Filter Exceptions: The Total Users Till Date filter does not apply to this KPI. |
| Topics (by user) The number of topics created by a user in the selected time. | ||
| Replies (by user) The number of replies created by a user in the selected time | ||
| Likes given (by user) The number of likes given by a user in the selected time. | ||
| Top users Likes received (by user) | The number of likes received by a user in the selected time. | |
| Top users Answers given (by user) | The number of best answers marked in the selected period where the user was the author of the answer. | |
| Top users - Points earned | The points earned by the user in the selected time | Users can have negative points if a like is removed during the selected time. For example, if a post was liked before the selected period and then unliked during it, the points for that period may be negative. |
Note: If you want to calculate these KPIs using data from the CC Data Lake, refer to the User Dashboard KPIs – Query Reference for CC Data Lake article.