
Engagements can be a crucial tool for onboarding and educating your end-users, making announcements about new feature updates or collecting feedback. Understanding your product's overall essential user engagement points or drop-offs allows you to create timely messages to help guide customers to key value actions for an intuitive user experience.
PX provides four types of engagement reports — In App Performance, Email Performance, Survey Performance, and Knowledge Center Bot Performance that explain how well your engagements are functioning.
Here’s a quick breakdown of each analytical report:
In App Performance
The In App Performance report shows all the analytics data for Dialog, Slider, and Guide engagements, including critical metrics such as views and completion rates.
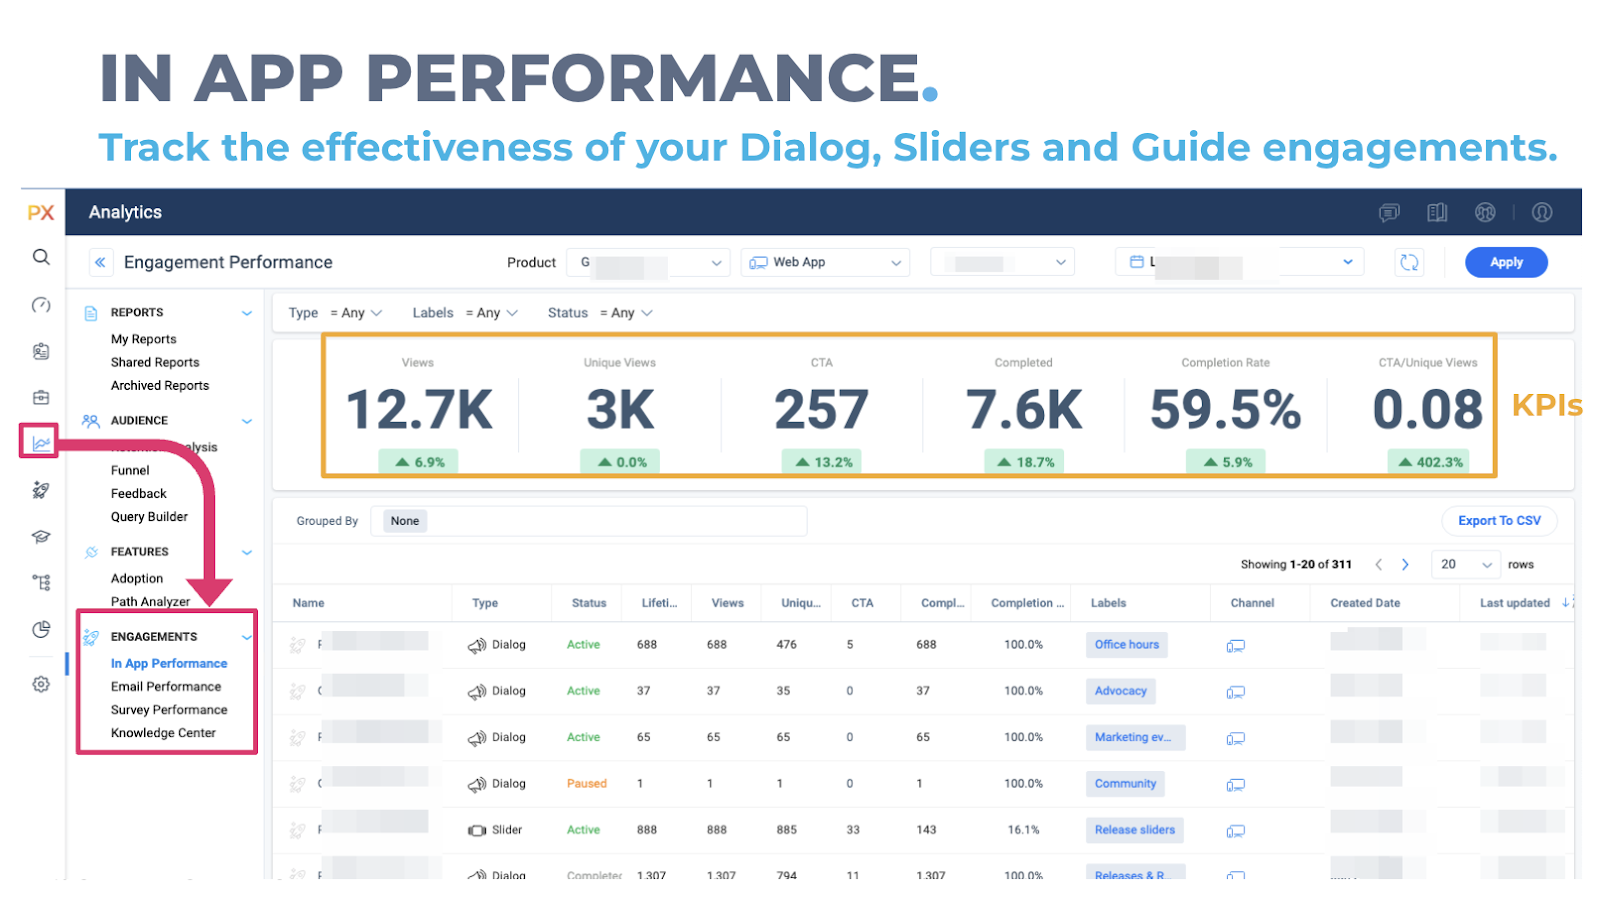
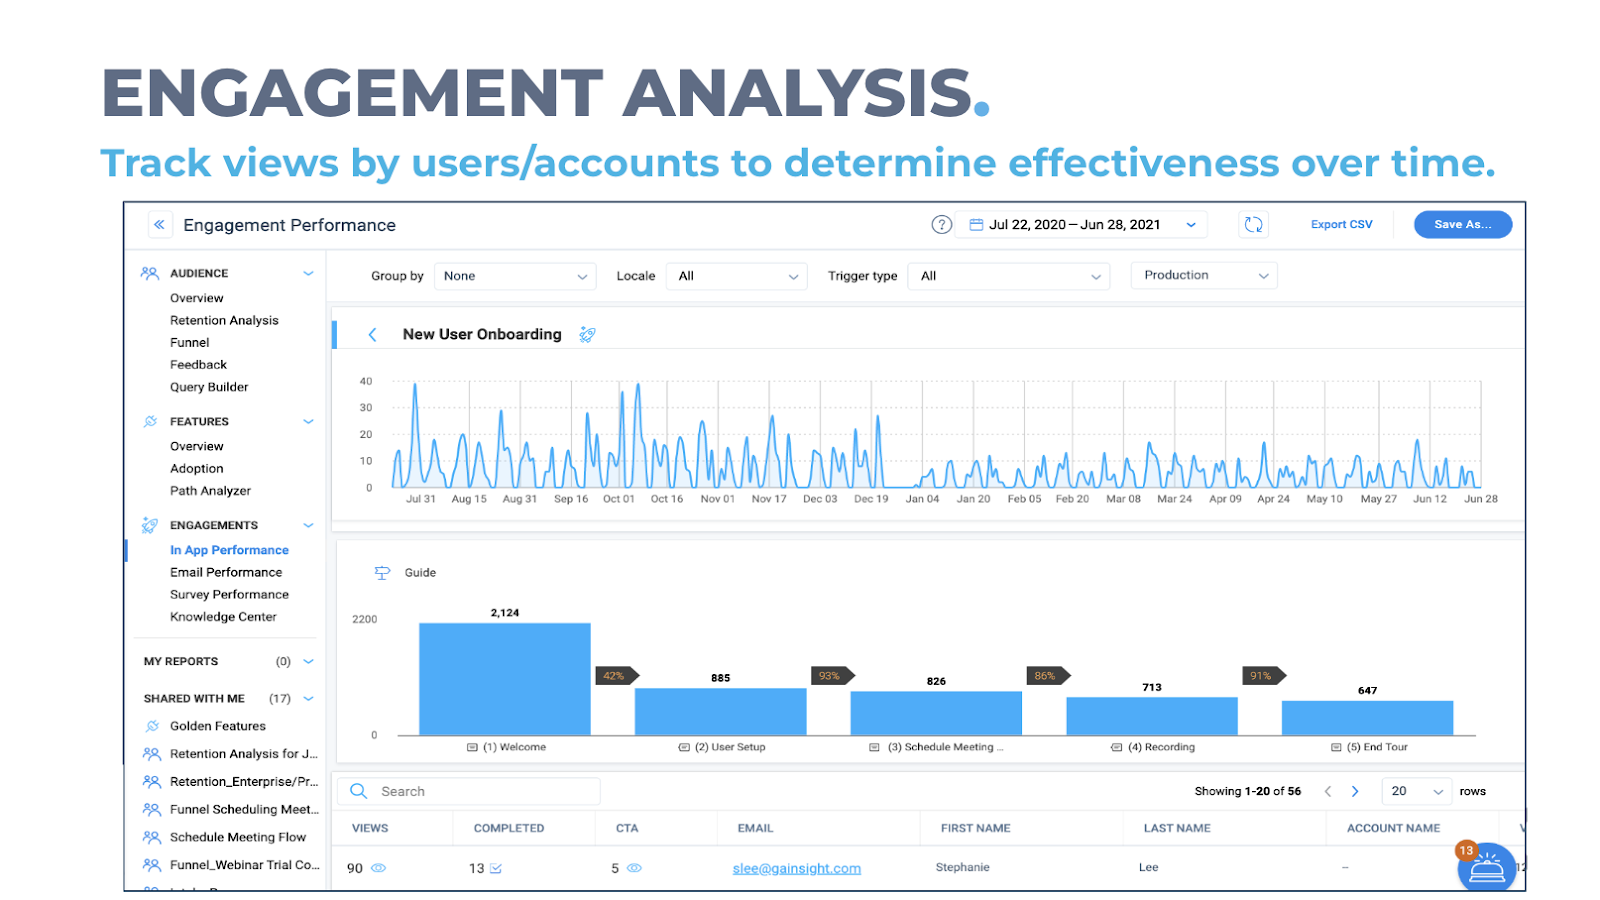
You can click any engagement to view drill-down graphical details and the list of users who viewed the engagement. For multi-step engagements like Guides and Sliders, you'll also see a funnel showing users' completion rates of each step in that engagement. This offers insight into when and where users drop-off while using your content.
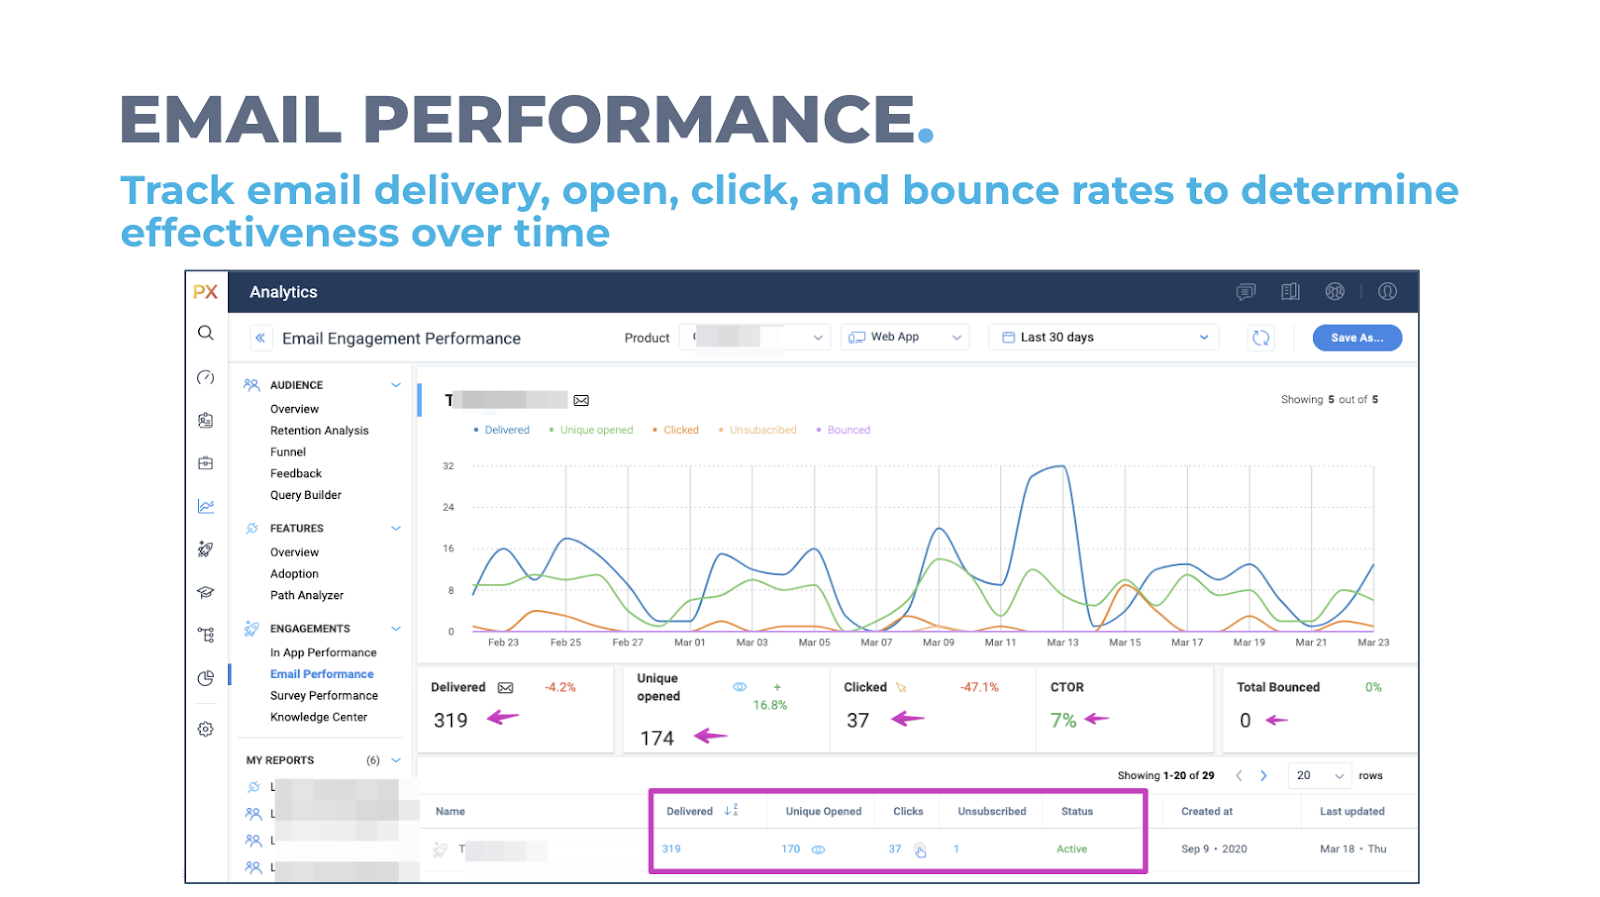
Email Performance
To track the impact of your messages, you can use the Email Performance report to analyze email delivery, opens, clicks, and bounce rates.
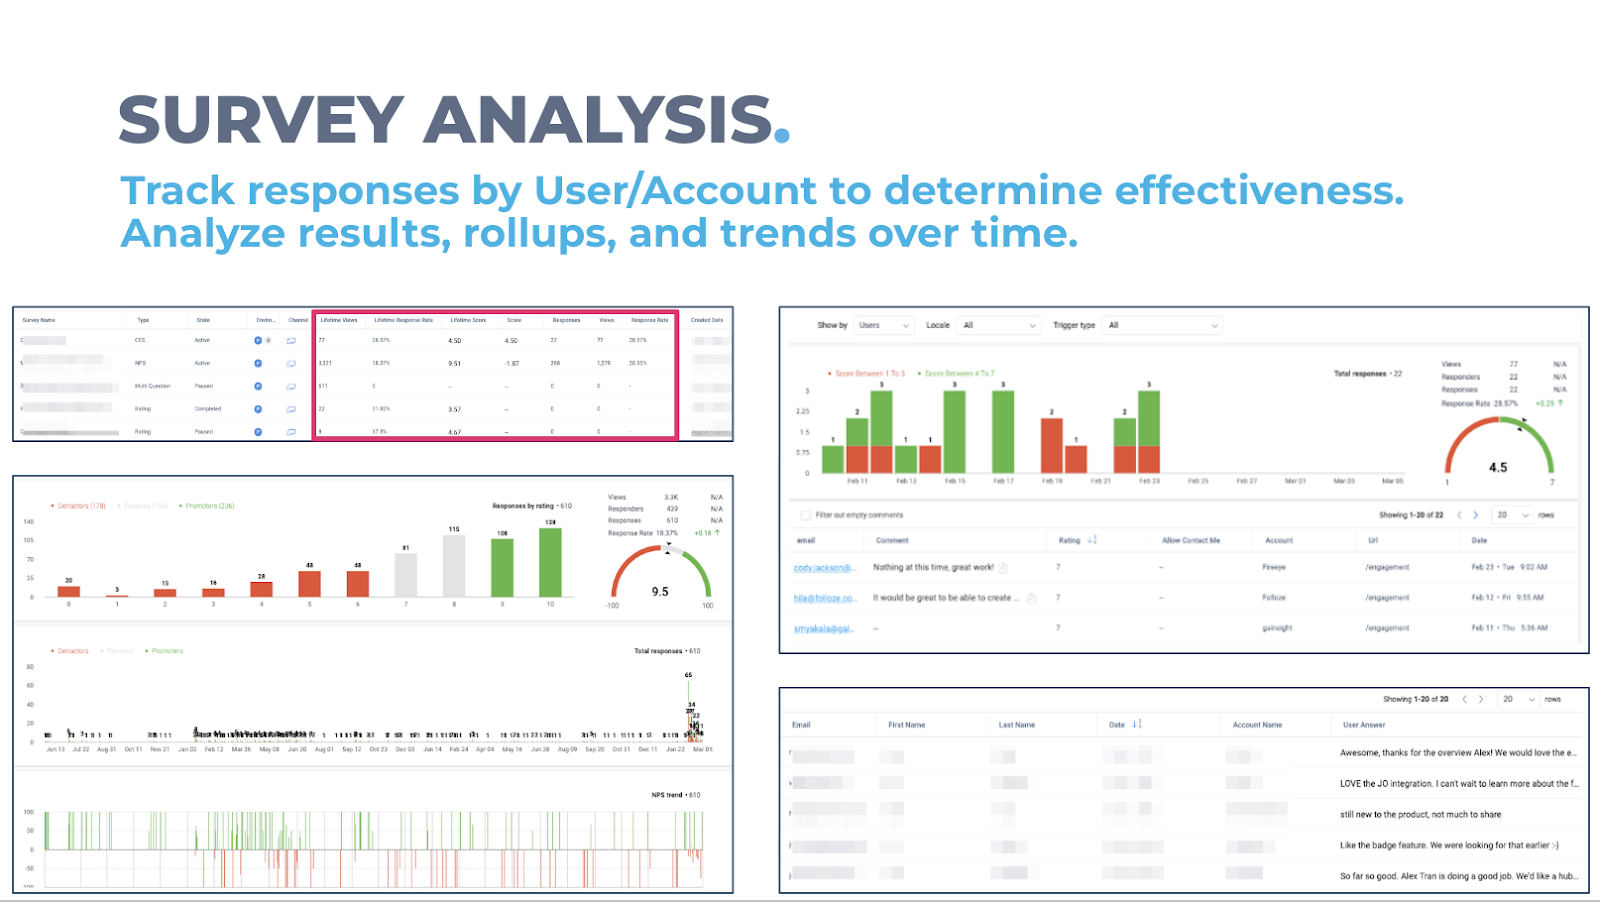
Survey Performance
The Survey Performance report displays NPS, CES, Boolean, and Multi-Question engagement results. By clicking on a Survey, you can easily view the survey responses to better understand the voice of your customers.
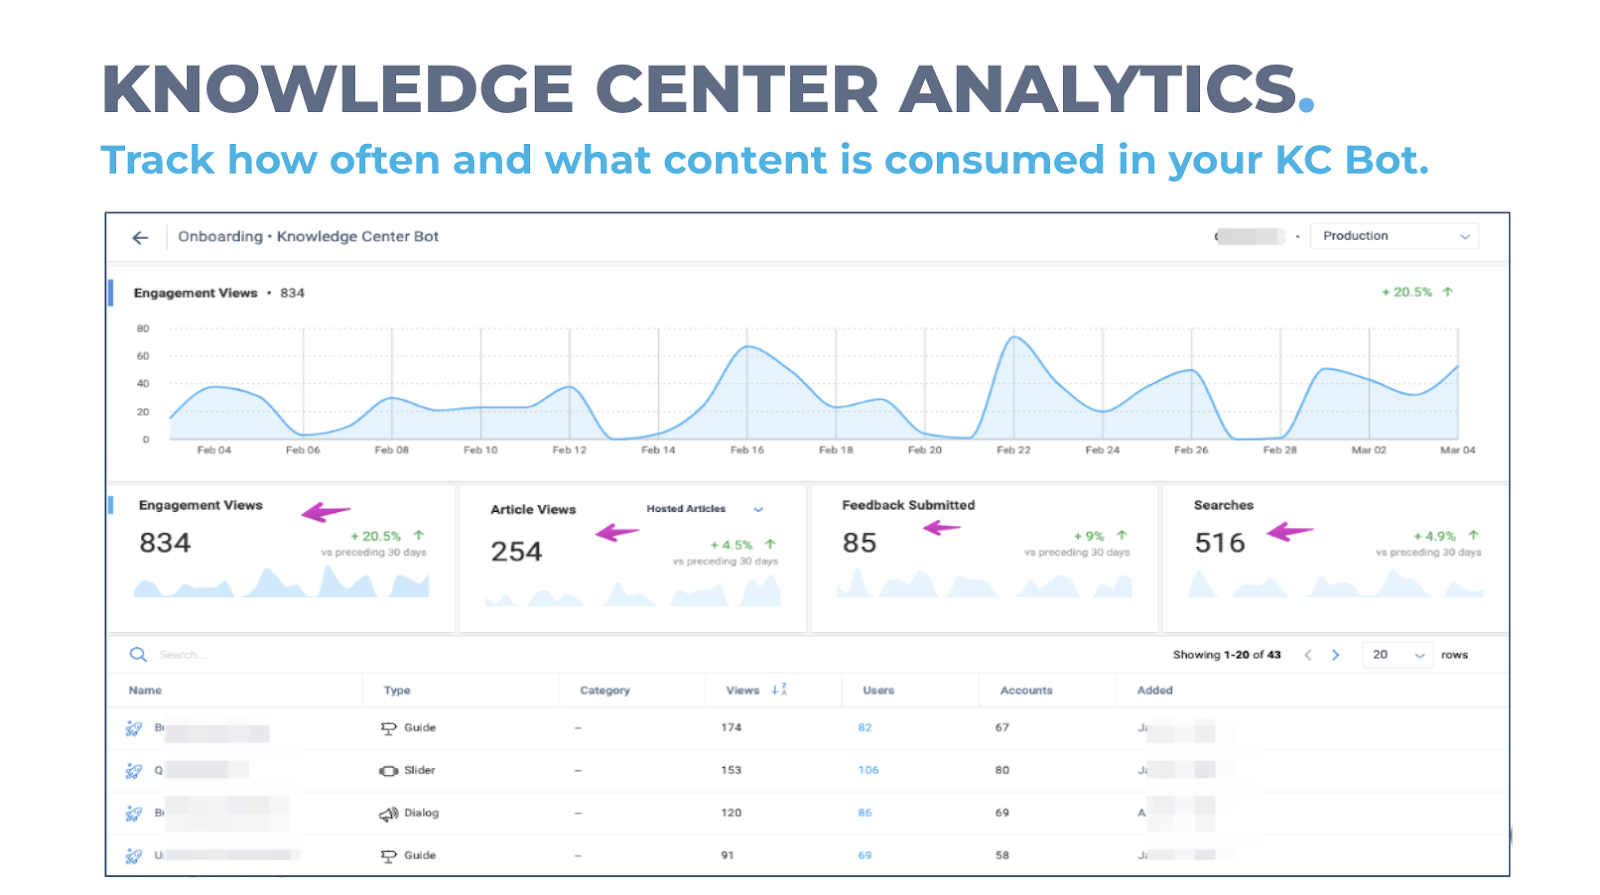
Knowledge Center Bot Performance
The KC Bot is a one-stop shop that guides new and existing users in learning your product by placing your knowledge base, in-app engagements, how-to articles, and a feedback module at their fingertips. The analytics tied to the KC Bot will help you understand how often the Bot is used, how many user views there are on Bot engagements/articles, or if the search terms are returning the desired results.
Pro Tip: Across the Survey and KC Bot reports, you can use the custom filter icon to target key audiences to slice and dice your data for better insights.
As you start collecting data on your engagements, you'll need to take action with your results. You can start by applying these three steps:
- Reviewing weekly to monthly results.
- Measure the number of views and completion rates.
- Continual track the impact of your efforts and identify ways to improve based on your customer's interactions with your in-apps.
