Hi folks,
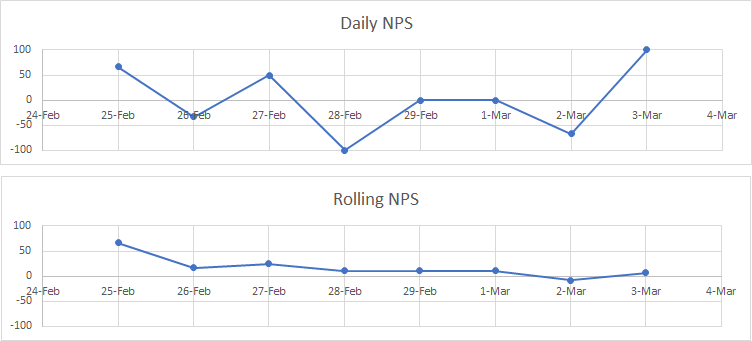
Would be great to see an additional graph that shows the trend of NPS changing over time, within the time window (i.e. a Rolling NPS score). The “trend” graph at the bottom only looks at one day at a time. The trend graph I’m asking for looks at the current day plus all previous days. So, it shows how NPS is moving over a time window.
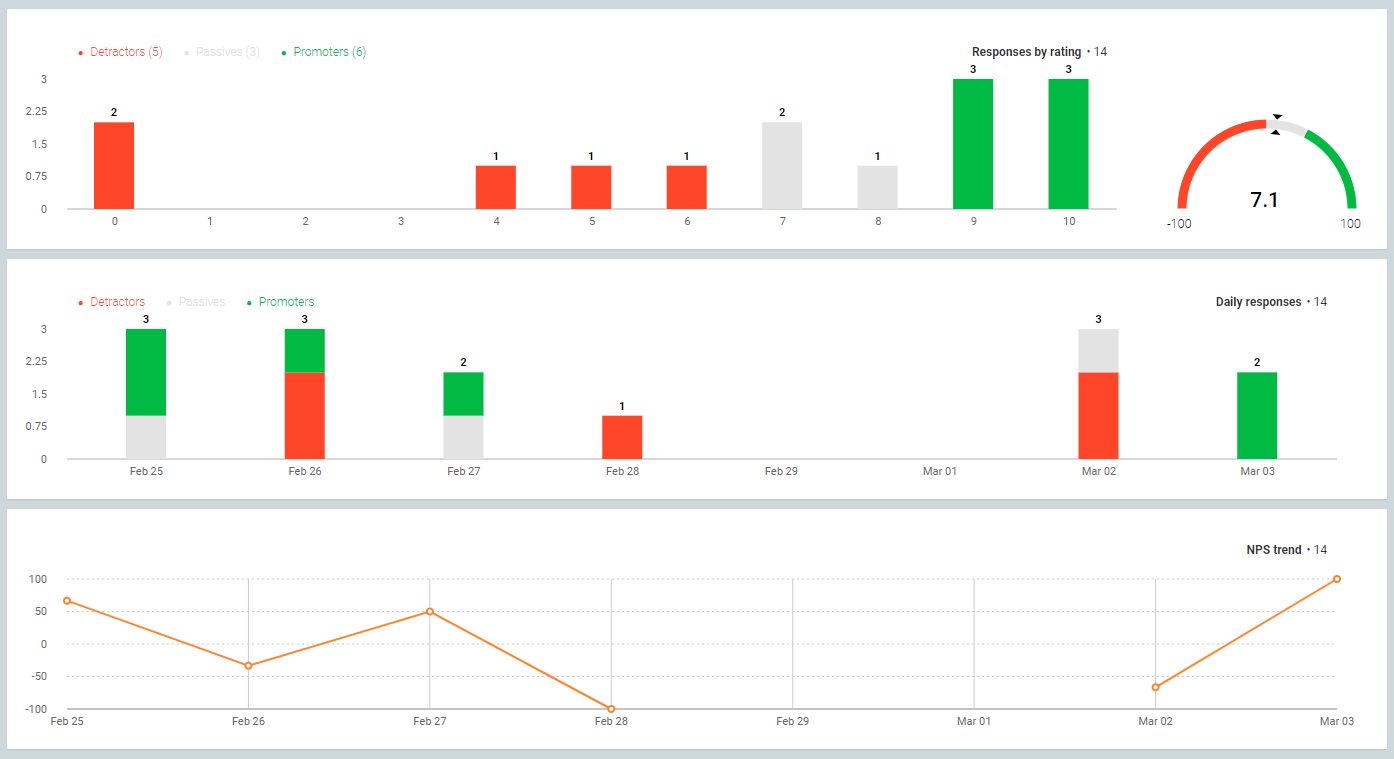
CURRENT REPORT
DATA SET
| Date | Promoters | Neutral | Detractors | Total | Daily NPS | Rolling NPS | |
| 25-Feb | 2 | 1 | 3 | 66.7 | 66.7 | ||
| 26-Feb | 1 | 2 | 3 | -33.3 | 16.7 | ||
| 27-Feb | 1 | 1 | 2 | 50 | 25 | ||
| 28-Feb | 1 | 1 | -100 | 11.1 | |||
| 29-Feb | 0 | 11.1 | |||||
| 1-Mar | 0 | 11.1 | |||||
| 2-Mar | 1 | 2 | 3 | -66.7 | -8.3 | ||
| 3-Mar | 2 | 2 | 100 | 7.1 |
FUTURE REPORT
To include Daily NPS (already included)
PLUS Rolling NPS (shown below)