
Gainsight Employee ⭐️
December 16, 2019

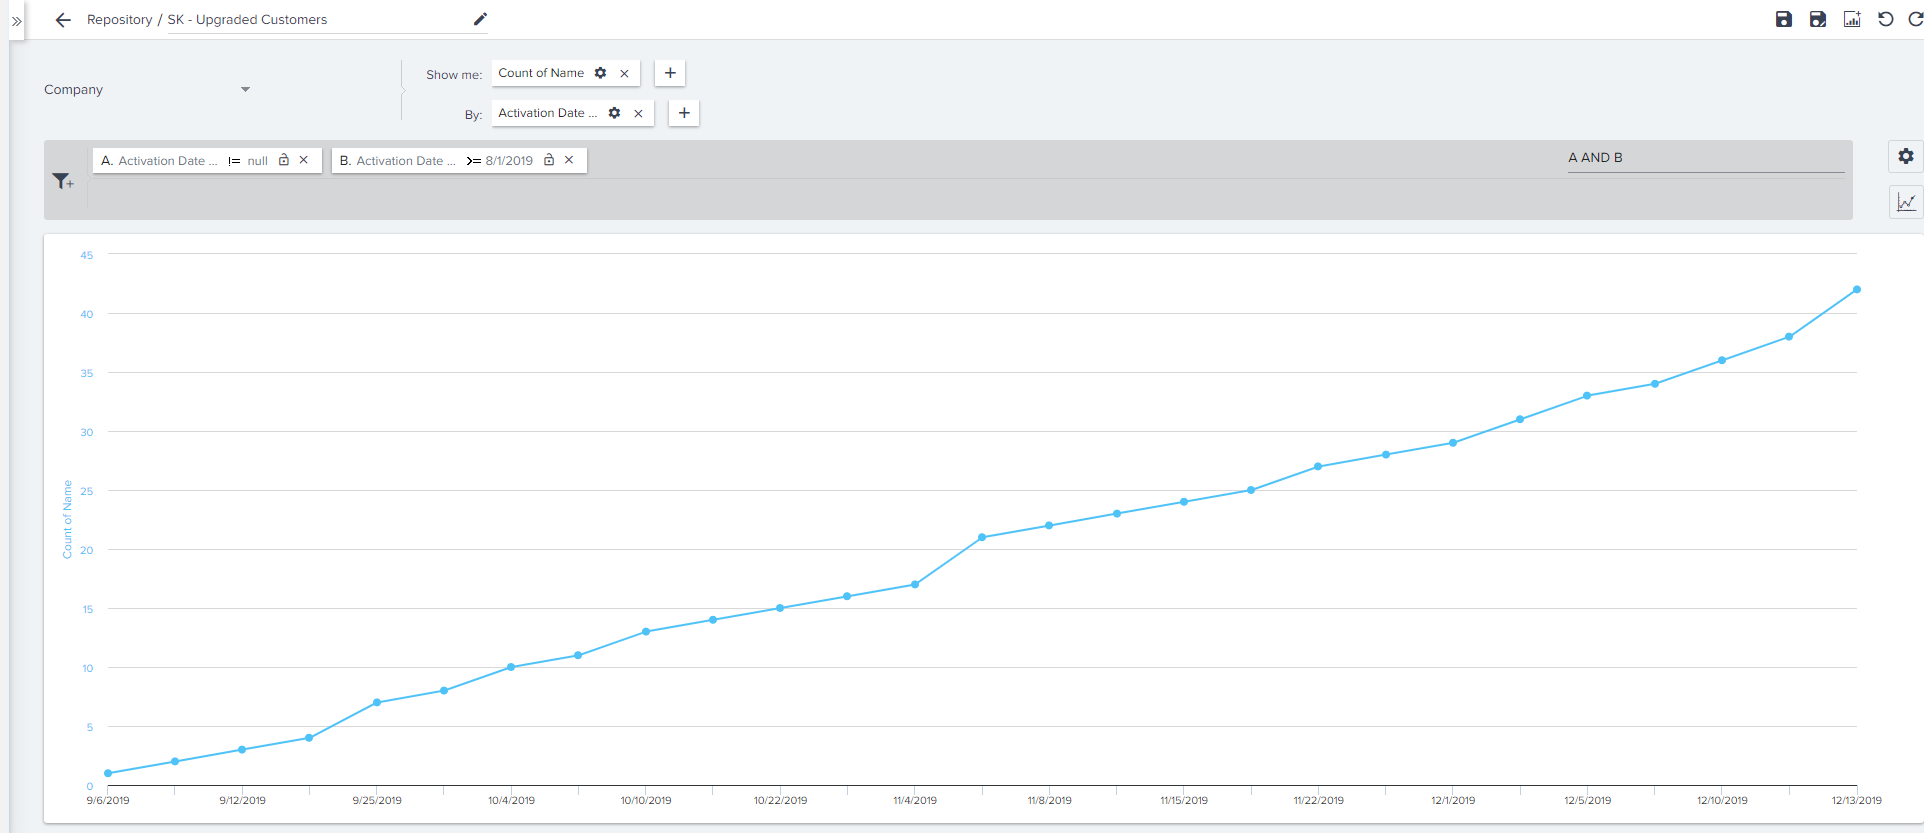
Will it be possible to display values at the data points(not when hovering over them)
  • December 16, 2019
  • 4 replies
  • 105 views

Will it be possible to display values at the data points(not when hovering over them)


    4 replies

    rakesh
    Gainsight Employee ⭐️
    Lets put your data to work!
    December 18, 2019

    We do not have this today, will plan for this enhancement in the roadmap. 

    lila_meyer
    Gainsight Employee ⭐️⭐️⭐️
    December 30, 2019

    Converting to an Idea (feature request) for better tracking.

    Lila Krutel, Dir. Global Education Services
    rakesh
    Gainsight Employee ⭐️
    Lets put your data to work!
    October 16, 2020


    @vijayasailesh Let me know if the above chart is what you are looking for

    Helper ⭐️
    July 27, 2021

    Hello Everyone,

    Happy to announce that your request has been considered and implemented in the Horizon Analytics in both SFDC (Link) & NXT (Link) versions. Horizon Analytics has new capabilities such as responsive charts and dashboards, flexible dashboards with more widgets (Image, Web Page, Rich Text), etc. 

    Following are the major advantages of Horizon Analytics:

    • New and improved User Interface based on the Gainsight Horizon Design System.

    • Easy access to a list of Reports and Dashboards.

    • Easy to share your Report and Dashboard through PPT or Link.

    • Ability to retrieve the deleted Reports or Dashboards from the Trash folder.

    • Easy to enable/disable the Report data downloads (including external links)

    • Easy to enable/disable the lazy loading of Report Widgets.

    • Easy to select the Color Palette, either Gainsight Defaults or Custom Colors.

    • Simplified drag and drop capability for adding fields to the Report.

    Thanks for posting!