Hi there, one of the main goals of our support community is to grow peer support i.e. to make sure our customers help each other out and answer each other’s questions.

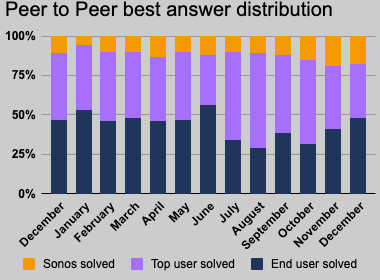
We measure our success there by calculating a monthly “answered by peer rate” 
(Sum of all Questions answered by customers) divided by  (Sum of all Questions answered) 

The only problem with that is that this only tells us part of the picture about how helpful our members are, because the “Best Answer” works on a “winner-takes-it-all-principle”. Click on “learn more” to see what i mean.

E.g. imagine the following scenario:
A user asks a question. 5 different users come to help with their solution, which is fantastic.

Then our own moderator writes a comment that sums up or validates the other replies. This comment gets selected as “best answer”.


Result: this thread, even if our user base was extremely helpful, has a negative effect on our “answered by peer rate”. but this should not be the case.


So I would like to also consider an additional metric to show us a more complete picture.

I would like to know:

The amount (or % ) of topics in which a fellow user commented on the topic, 
(a dialogue between OP and Moderator would not count).
Or, basically % of topics in which a certain custom role added a comment (or a certain primary role did not comment)

Does anybody have an idea how to calculate that? Any clever workarounds?
Single User Topics” does not help, because it only shows “monologues”

Thank you so much in advance!

Cheers,
Daniele

Ciao @Daniele Cmty 

You got me thinking on this one as I was working through some analytics.

I may have something useful.


It starts with a POST export. This gives me all posts in the time frame with userRole as a field.


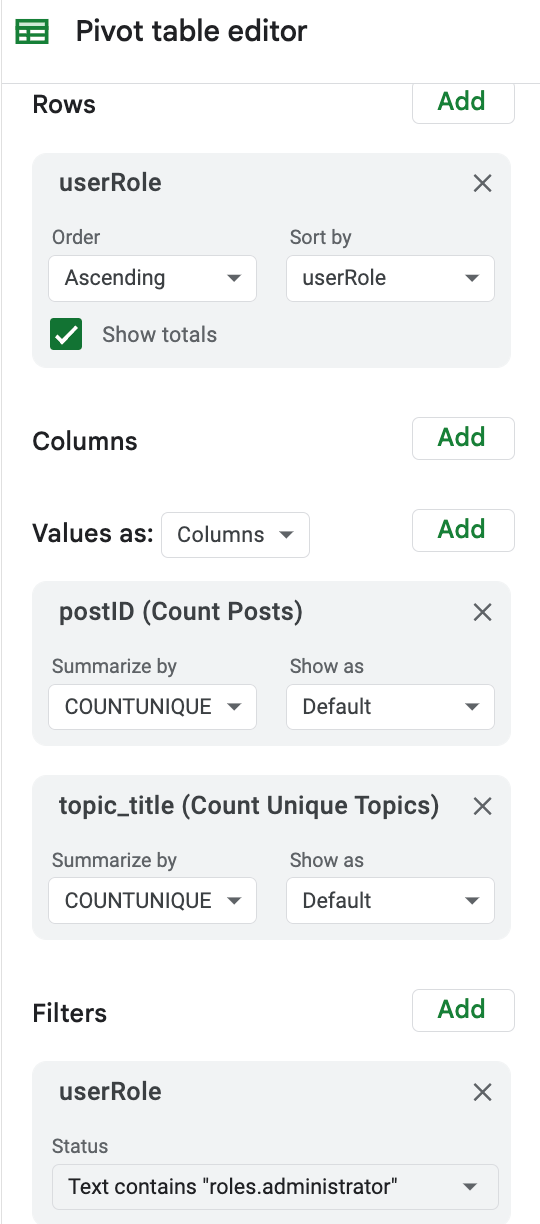
If I then create a pivot table and set it up thus;

  • Rows = userRole
  • Values give the number of unique posts per role AND the number of Unique Topics per Role (this is what we want)
  • Add a Filter to only consider userRole contains roles.administrator (or any other role you wish to view)

You then get a table like

So 406 topics had administrators responding to them.


If I remove the filter I can see the total unique topics 1522.

So 406/1522 makes 26.7% ish of topics had administrator intervention.

Does that make sense. ?


If you want to get together and thrash it out further I would be happy to. 😀

@Julian for FYI


Hi @Alistair FIeld thank you so much for your reply - a Pivot Table was exactly what I was thinking, but I couldn’t figure out a good system. Awesome!
At first sight it looks quite doable & exactly what I wanted to figure out!

Now it’s late in the day & my brain is worn out but I will have a closer look tomorrow and try it out myself. Will report back :)
 

Cheers,
Daniele


The count of posts part could probably be ignored. I was using it sanity check number or topics etc.


I also think the post export should hold all the information that you are looking for. Two thoughts as an addition:

Be aware that a post export will also include replies to topics that have been started / active before the period which you have exported. E,g, A topic could have been very active last year, this year there was only a single new reply. If you only export this year, your results will be skewed slightly as a result. Might be edge cases, but wanted to make sure this is clear.

Also, if you seek to report on this on a monthly basis, you might want to think about an automation. We are working on a data lake right now, which will allow you to directly connect community metrics to your BI tools. This way, you could come up with a much more elaborated way to measure this KPI. You could already do that via API right now, but I would recommend to wait for the data lake, as it will be much more easy to integrate.


Be aware that a post export will also include replies to topics that have been started / active before the period which you have exported. E,g, A topic could have been very active last year, this year there was only a single new reply. If you only export this year, your results will be skewed slightly as a result. Might be edge cases, but wanted to make sure this is clear.


Really good caveat to keep in mind, thanks for thinking along with us!

If we want to strictly exclude topics that were created before that time period, we could go the extra mile and combine the above data set with a historic topic export.  
Then with VLOOKUP grab a column with topic creation date, which can then be used to filter out older topics. Would add one dimension of complexity but I think that should do the trick :)


Excellent, that would work indeed!


@Alistair FIeld s way of pivot tabling will work beautifully to get your data point, @Daniele Cmty.

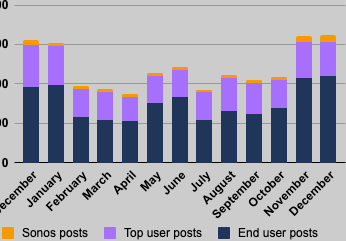
However, I don’t think that the summary best answer necessarily makes a ‘bad’ data point (quite the opposite actually). Yes, it takes away from P2P Best answers but instead of ‘disqualifying’ it from a data perspective, I’d lower the expectations of the P2P rate.  Instead, or more importantly in addition, I’d also report on the ‘content split by user group’ between staff, top users, and regular users, and then describe how your users are wonderfully contributing to best answers, that are then summarized by staff for SEO value.

P2P is great, but it should be looked at the same way that Customer Satisfaction is, particularly from a reporting perspective: We of course expect our support agents to do their best, but there are just some things that are out of their control, and they shouldn’t be punished for that. So CSAT is set to for instance 80%. Same goes for P2P - we’d love to see 100%, but it’s just not feasible, and if your moderators and staff are tasked with summarizing content for the sake of great best answers that feed into SEO, then a lower P2P rate should be expected and accepted.


Reply