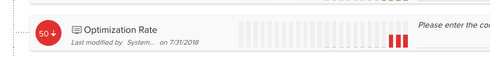
Also, I understand that the arrows are supposed to be trends, but I'm not understanding - like the below shows a downward trend but all of them are red and have the exact same score of 50, shouldn't it be a side arrow?
If you ever had a profile with us, there's no need to create another one.
Don't worry if your email address has since changed, or you can't remember your login, just let us know at community@gainsight.com and we'll help you get started from where you left.
Else, please continue with the registration below.
Enter your E-mail address. We'll send you an e-mail with instructions to reset your password.
