I want to create a report that shows me overall healthscore by account over time.  I can see it one account at a time but I need to produce the data for all accounts in one report.
Hi Pat,


How many accounts do you want to view simultaneously? This report can get a little crowded if you have a large number of accounts to view all on the same view and broken out by account. Here is an example of what the report would look like. I included the data object and reporting fields so you can see how to create this report in your instance.


Another option would be to aggregate customers within the same segment. The example below shows how this would look. It's the same report as above, but instead of using Account Name as the second aggregation, I'm using the segment field.


Is this what you had in mind or were you looking for something different?


-Dan
Is there any update on a simple report for this? 
Do you find the reports, mentioned by Dan above useful ? Did you like the idea of looking at the health score trends by customer segment (second report above, assuming you have your customers segmented ) ? 
No, we don't have segments to be able to achieve this. 
Hi Sophie, how many customers did you want to report on at a single time? 
I do not find them useful!


Hi Dan, I would love to reopen this topic. We have a few thousand organizations that we want to filter out just the organizations that are trending up or down week over week. Are we able to accomplish this so that the visual doesn't look so darn crowded?


Hi Alison,


On the Scorecard Fact object there is a field called "Trend". This will indicate the relationship of the current score to the previous score.


-1 means the score is trending down


0 means the score is flat


1 means the score is trending up


You can use this field to filter, group, or aggregate your data, depending on what you need to show and how granular you need to get.


Hope this helps!


Hi Dan,


When I try to leverage the Trend field, it is unclear! When an organization has the same data in week 1 vs. week 2, the trend value doesn't change to 0. How long does that trend value stay as +/- 1 before it changes back to 0 when the data has not changed the next week?


I also tried to use Trend >= 1 on a report as a filter, but the value of -1 kept showing up in my report. Is this just a bug?


Sorry for all of my questions! I tried to leverage Trend, but it is not an intuitive field. I feel if I better understand how it's calculated and the frequency in which it's updated, then I'll be better able to create the reporting I need to get a bird's eye view of all of our accounts that are changing health scores week over week!


Hi Alison,


It might be easier to have someone work with you on this live. We host weekly Admin Office Hours for questions like this. You can register via this link: https://community.gainsight.com/conversations/us-admin-office-hours-32819-time-change-11-am-ct-5c98daebe4b06ca235a5672d


It looks like the images you included in your original response is no longer showing. I too am interested in producing a report that shows the overall score for an account by week. This can be found on the C360 section, but is there a report type and way to produce a report that lists each account and the score for each week that has been captured? Essentially a list view of the trend graph shown on the C360?


@jessica_owens We will bump up the priority for this, and will work on it in the near-term. It will most likely be available next quarter.


Regards,

Shantan


@shantan_reddy thanks for the update on this. I look forward to this report becoming available.

So I can set expectations internally while we await this report. The C360 trend report for the overall score shows 18 weeks of data. Is that all that the system holds (last 18 weeks) or does it store all previous week’s data, but only reflects the last 18 weeks in that trend report on the C360.

The reason I ask is that as we wait for this report to become available and the system only stores the last 18 weeks of data, we could lose access to some of the data points reported for Q4 2020. Make sense?


@jessica_owens We store a weekly snapshot of your scorecard data for the entire period from launch.

Also, if all you are interested is in the weekly snapshot in a tabular form, you can already do it by building a report on the scorecard history object for accounts/relationships. Do let me know if this solves your use-case.


Regards,

Shantan


@shantan_reddy that is what I’m looking for, but I’m not getting the expected result.

I want a table view report that for each week of the period (Q4 2020 for example) lists the following: customer name, snapshot date and the overall score of that snapshot date. I built a report off of the Account Scorecard History and it’s showing the CURRENT overall score for all snapshot dates, not the overall score from the particular snapshot date.

Below is the report I have configured, can you recommend any changes that would provide the correct result?


@jessica_owens This should work. It’s strange that current score is being shown for all snapshot dates.

 @silpa1234 Any inputs here?


Regards,

Shantan


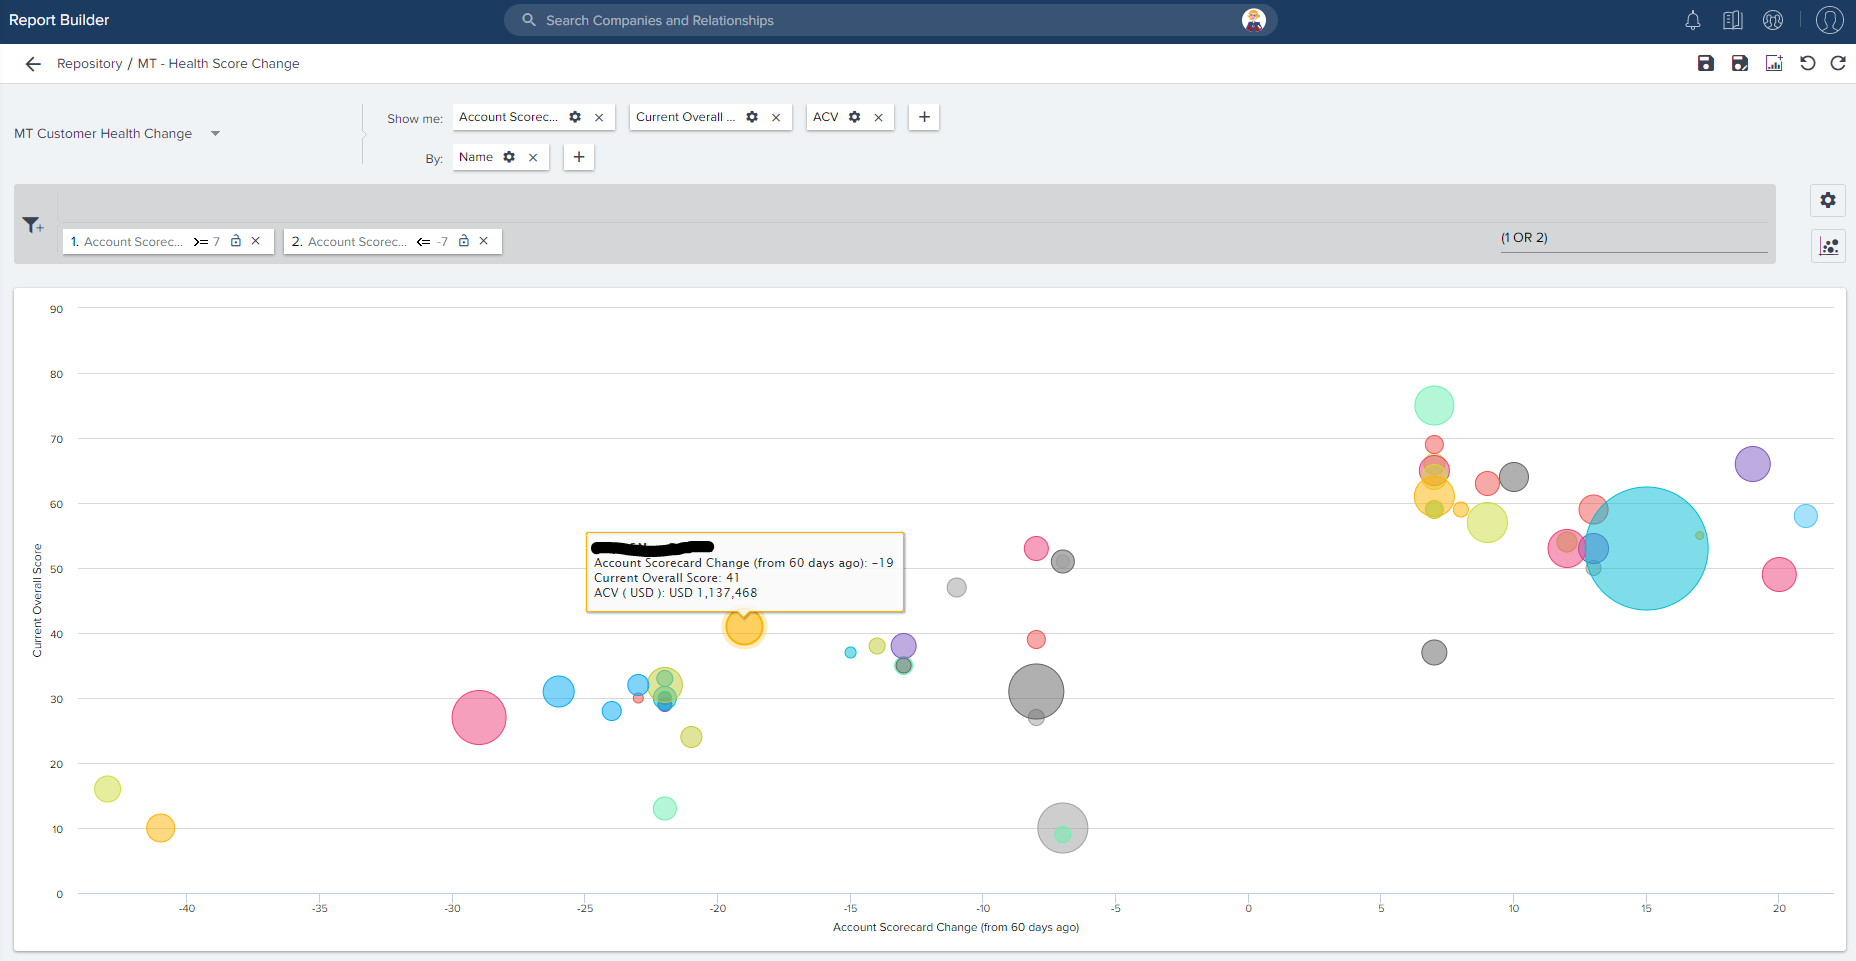
Using data designer I created a report that compares the current healthscore of a customer with what it was 60 days ago and displays the info in a bubble chart (filtering out scores that didn’t really change very much). It updates every week so its a quick way to see which accounts have significantly moved in one direction or the other: 


@jlicciardello - that’s a great idea for a different project. Thank you for sharing that!


@shantan_reddy and @silpa1234 - I’m looking at doing a scorecard analysis and comparing the customer’s overall healthscore at the time that a churn event took place in Q4 2020, so we can see if we should make any tweaks to weighting or anything else. When running the report in my previous reply, I was hoping to get a list of customers and the overall score for each snapshot date. Instead I’m getting the current overall score for each of the snapshot dates in the report. Any suggestions I can apply that will give me the desired result? Thanks!


@shantan_reddy and@silpa1234 - after digging into this a bit more. it looks like I’m missing the Overall Score (Account) field on the Account Scorecard History object. Is there simple steps I can take to enable this field on this object in my instance or this is a support matter? Thanks!


@jessica_owens It should ideally be available in the scorecard history object. If unavailable, please raise a support ticket.


@shantan_reddy - thanks for the follow up. I did create a support ticket to get access to that field. Once available in my org, I’ll use that field to see if that solves the issue that I’m having with this report.


@jessica_owens Happy to help! Do let me know if you need more info on this.


Regards,

Shantan


I created a custom object to store a Weekly Snapshot only if the score changed. This allows me to see how many days/weeks a customer typically remains in any given health score and we can track the transition history and trends. 

  
End Proctoring-
 

@shantan_reddy - were you able to create a trending report for customer health score by week/month in tabular format? 


I am looking for something like this for our team but in a single report rather than going to individual account.

Customer name, Health score in Jan, Health Score in February…..


You can get this using the new reporting, and data designer. Pivoting is available in the new reports. 

Filtering for a monthly snapshot on scorecard history object, and pivoting on date should do the trick.


Regards,

Shantan


Reply