

darkknight
Expert ⭐️
March 16, 2021
New Idea

Horizon Analytics feedback

  • March 16, 2021
  • 38 replies
  • 792 views

Not sure the best way to give feedback on Horizon Analytics since I don’t believe it is technically still in Beta… so will start this thread to capture as I am kicking the tires on it.


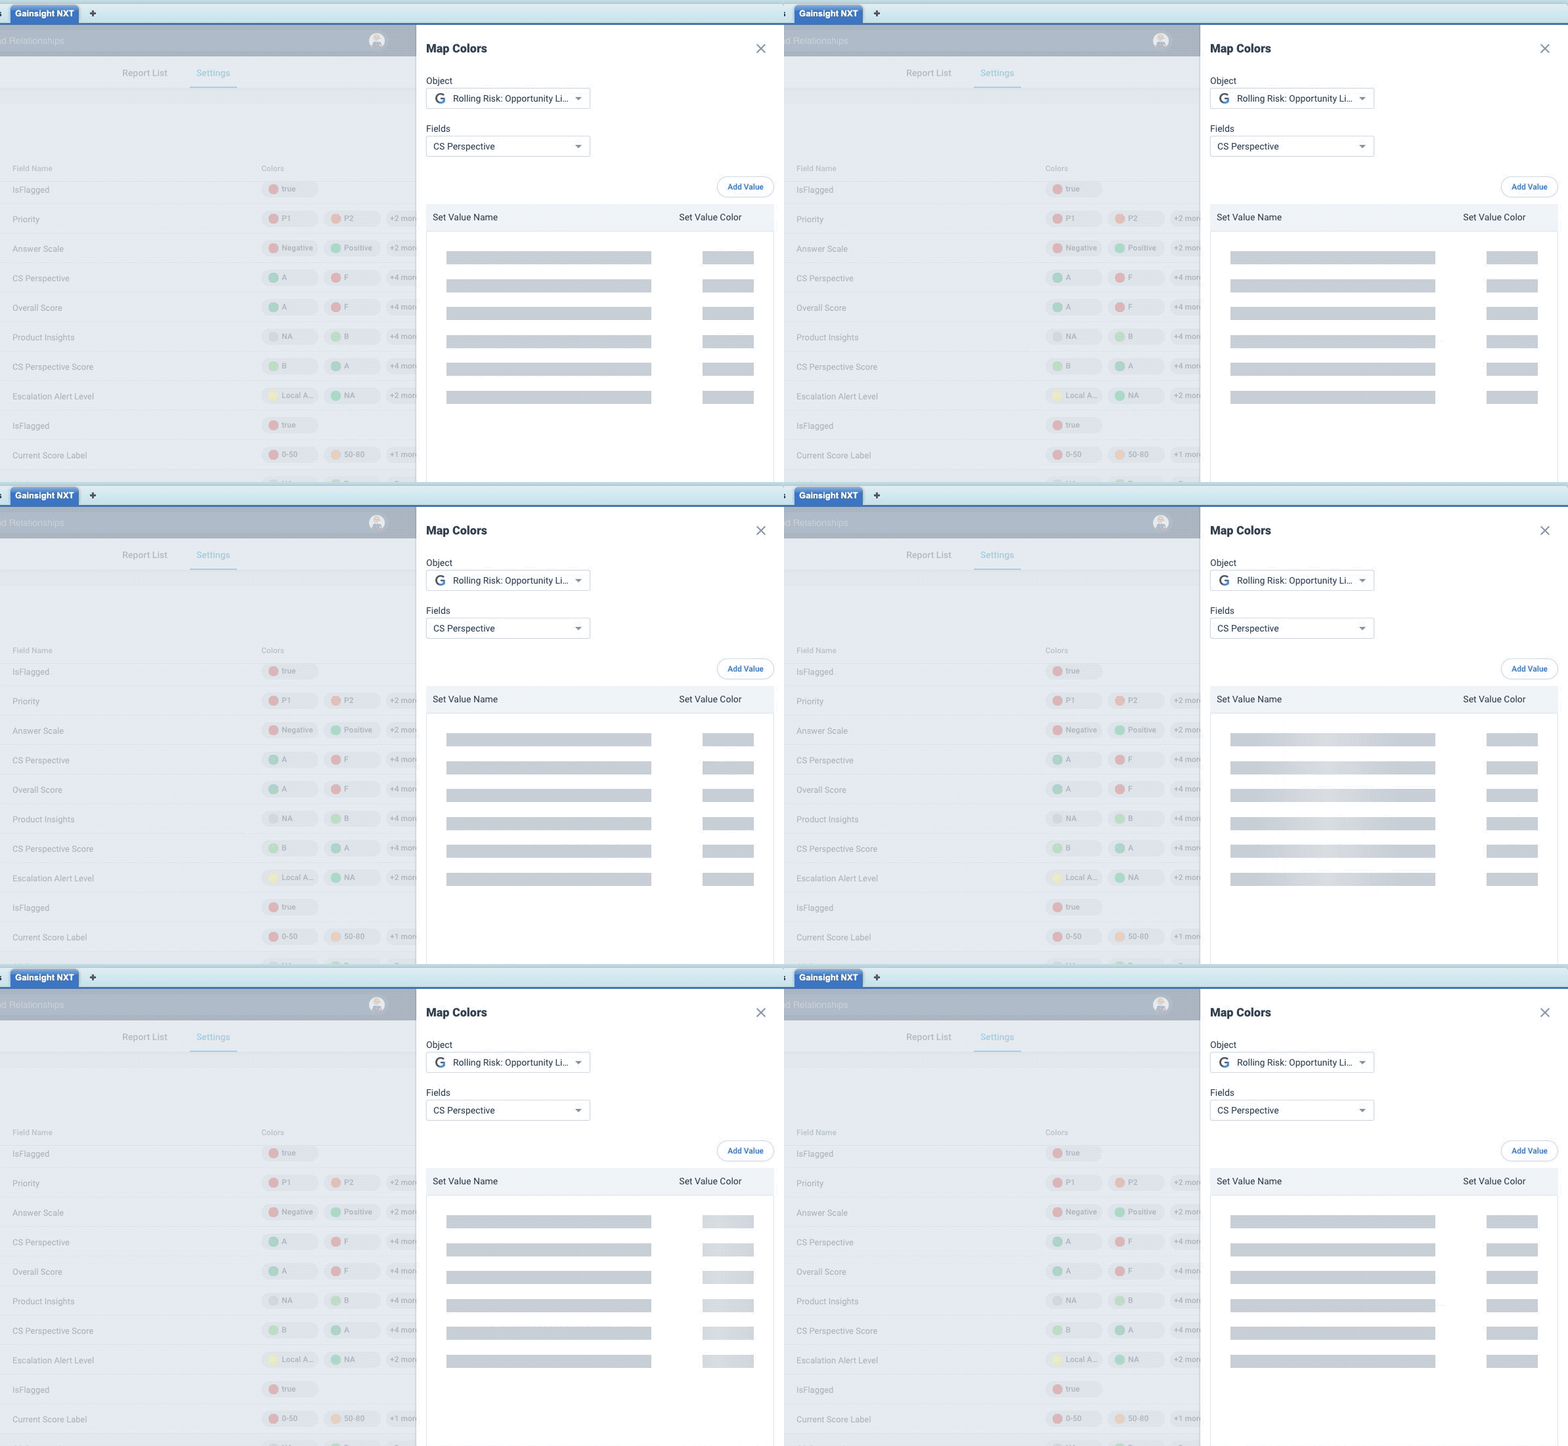
  1. When I try to access Custom Colors in the new UI, I open an existing entry and the data never loads (this was done in an Incognito browser window, so it’s not cache)
  2. When drilling down into a report from a dashboard, the “Analyze Report” button should not
    appear
    for users that do not have access to Report Builder. 
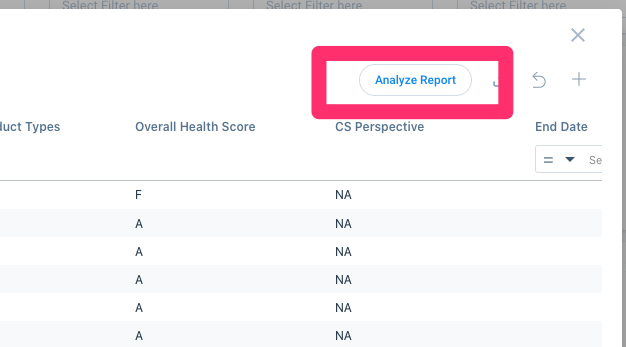

    When a non-privileged user clicks that button, they get a “403 Access Denied/Forbidden” error.  This will result in numerous tickets sent to admin teams saying there is a problem or requesting access.  This should be disabled for all users that do not have access to Report Builder.
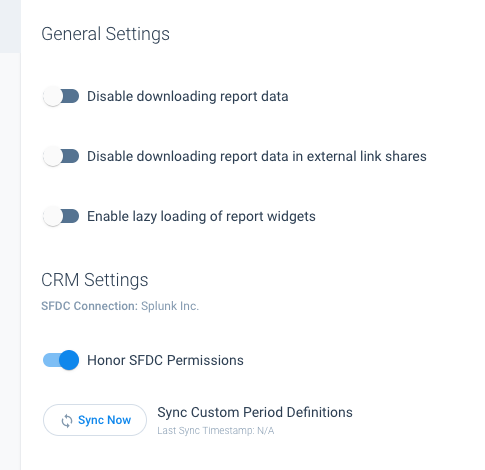
    Here are my current report builder settings: 


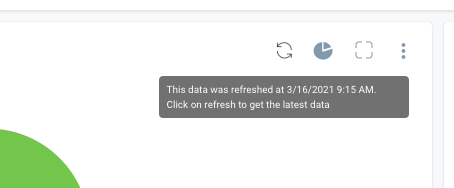
  3. The text that accompanies the refresh button on charts/graphs is misleading.  The example below indicates that the data was refreshed and that if you click on refresh you’ll get the latest data - but this particular graph pulls from a data table that only gets refreshed once per day.  The language here should be modified to remove the confusion.
  4. I have a chart that appears to have an unexpected item in the legend in the new UI, but it doesn’t have that in the old UI (hard to see bc of the custom colors, but there is a cream color there, the same color that matches the N/A value)
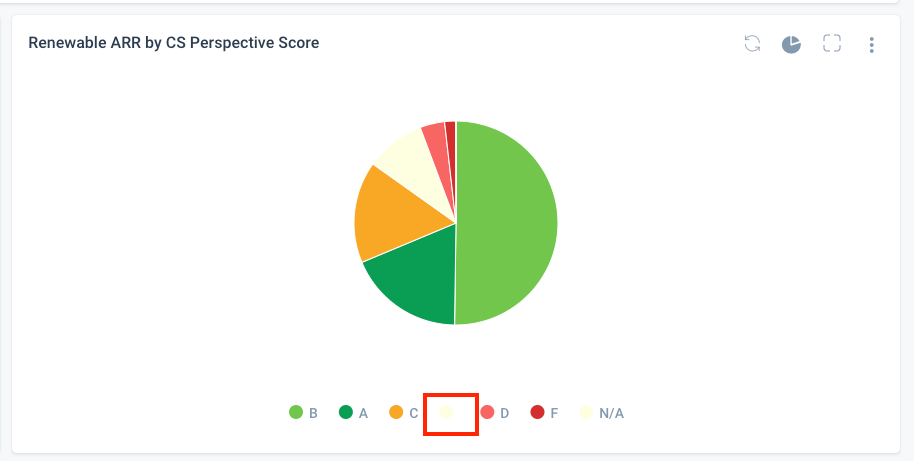
    NEW UI
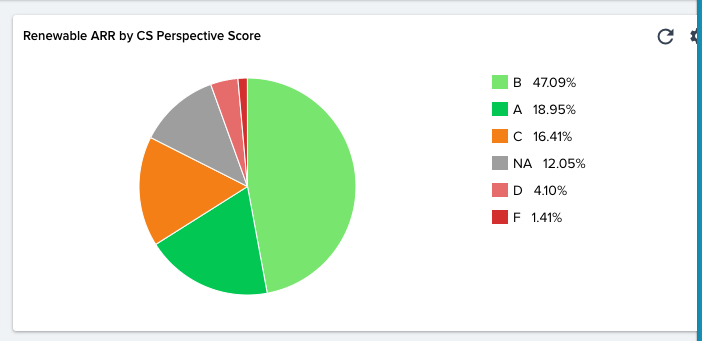
    OLD UI
  5. Regarding the “You did some modifications to the dashboard. Do you want us to remember them”
    • It is more grammatically accurate to say “You made some modifications to the dashboard.” 
    • It does not respect the pinned navigator - the message gets cut off:
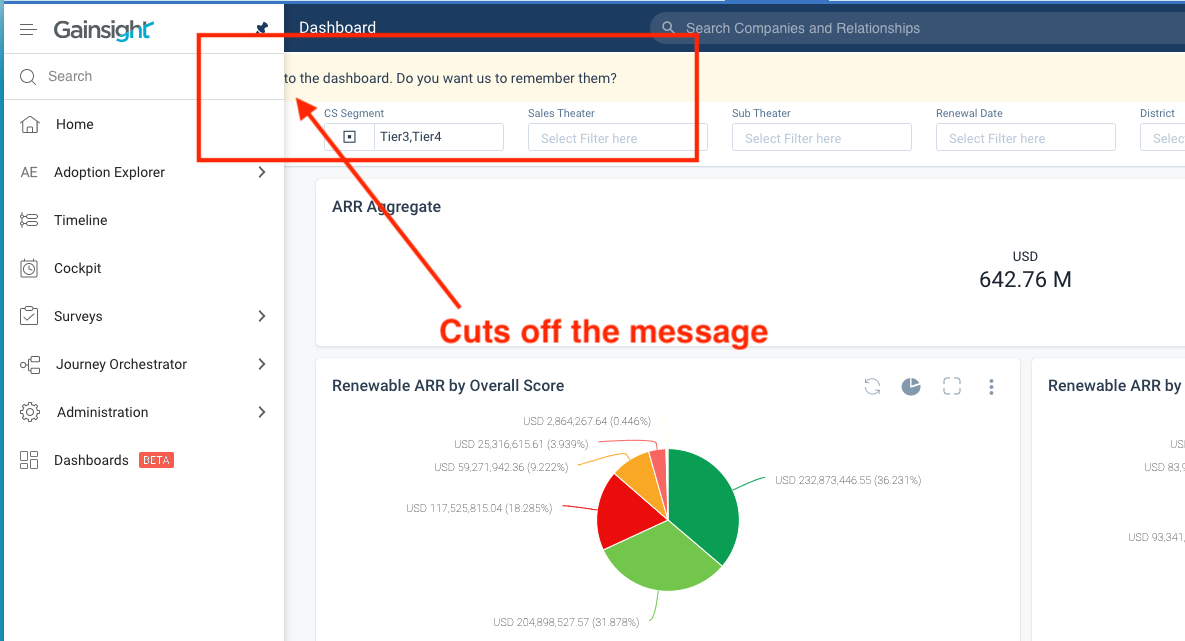
       
  1. Clearing a filter takes two steps now instead of one:
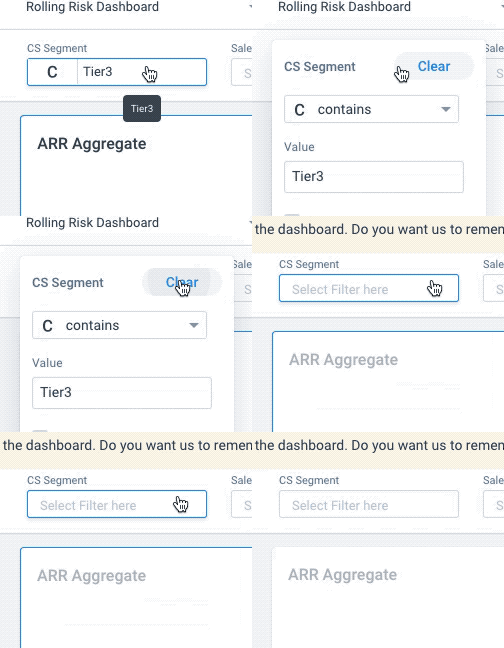
    New UI
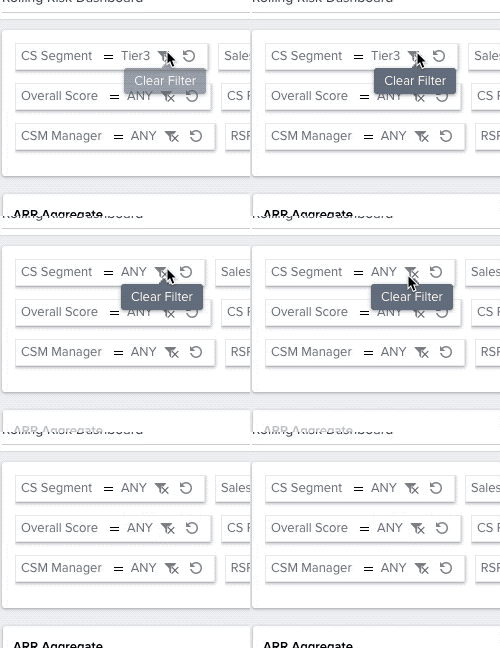
     
    OLD UI
    1.  The date filter is a bit awkward in the new UI… you have to scroll to the right in order to add a second date for a custom Between statement… would be better to have the date fields stacked vertically without the need to scroll:
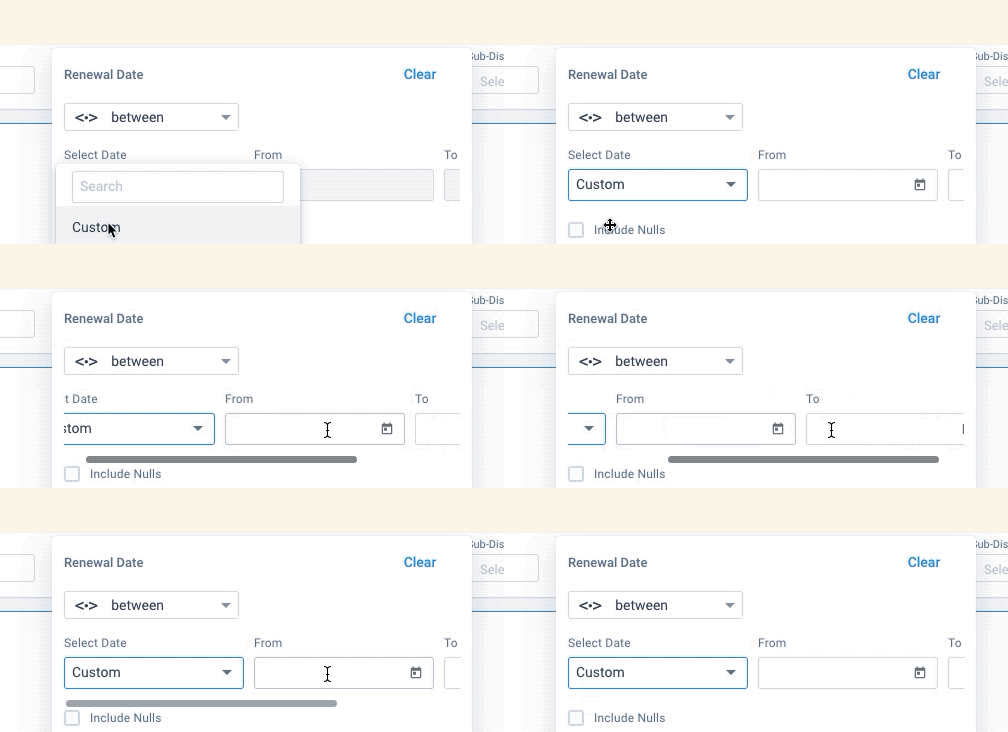
      NEW UI
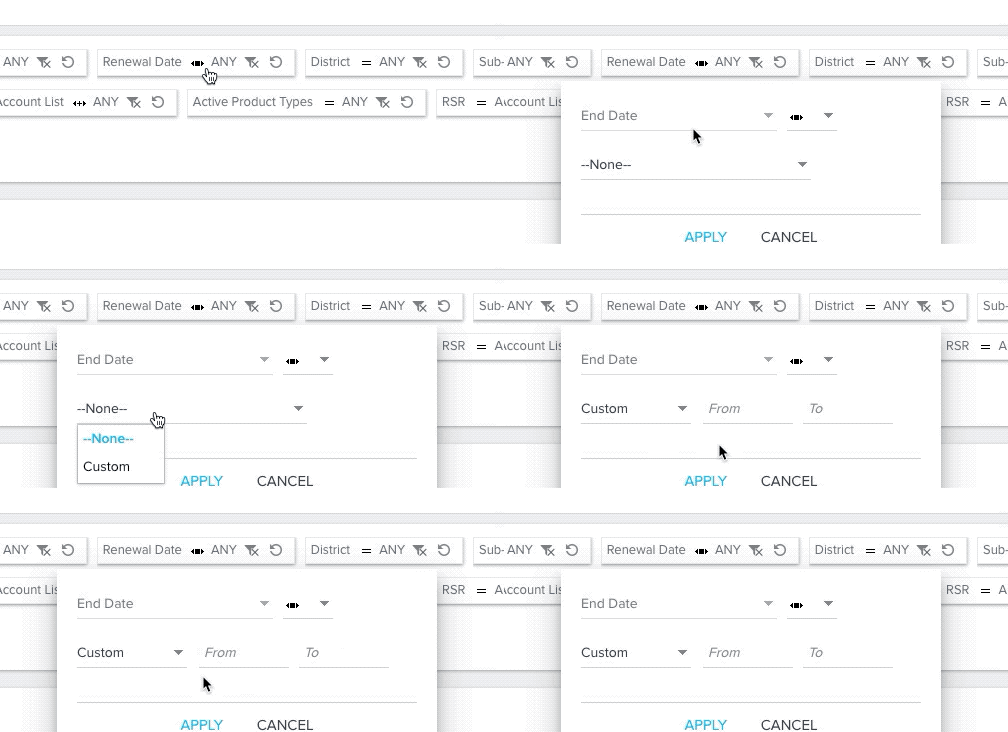
      OLD UI


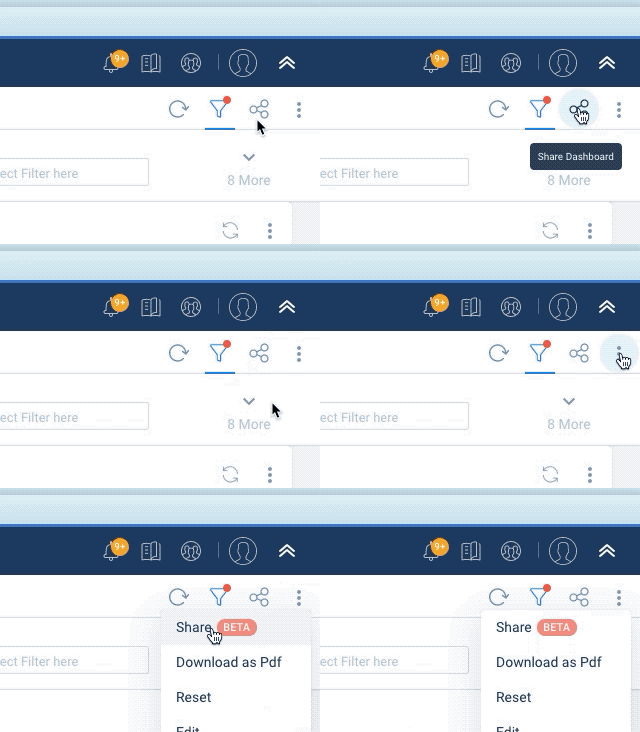
  1. When sharing dashboards, I am only able to pick a NXT-direct domain to share - what if the dashboard has SFDC reports on it?  We need to be able to share a link that is displayable via SFDC:
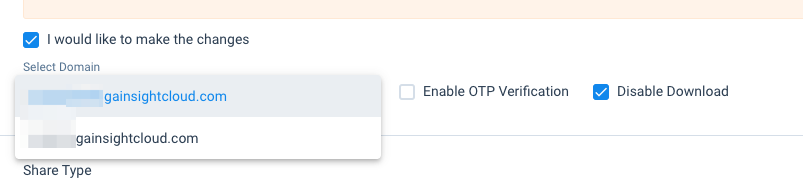
     

  2. Are there supposed to be two sharing options?
     

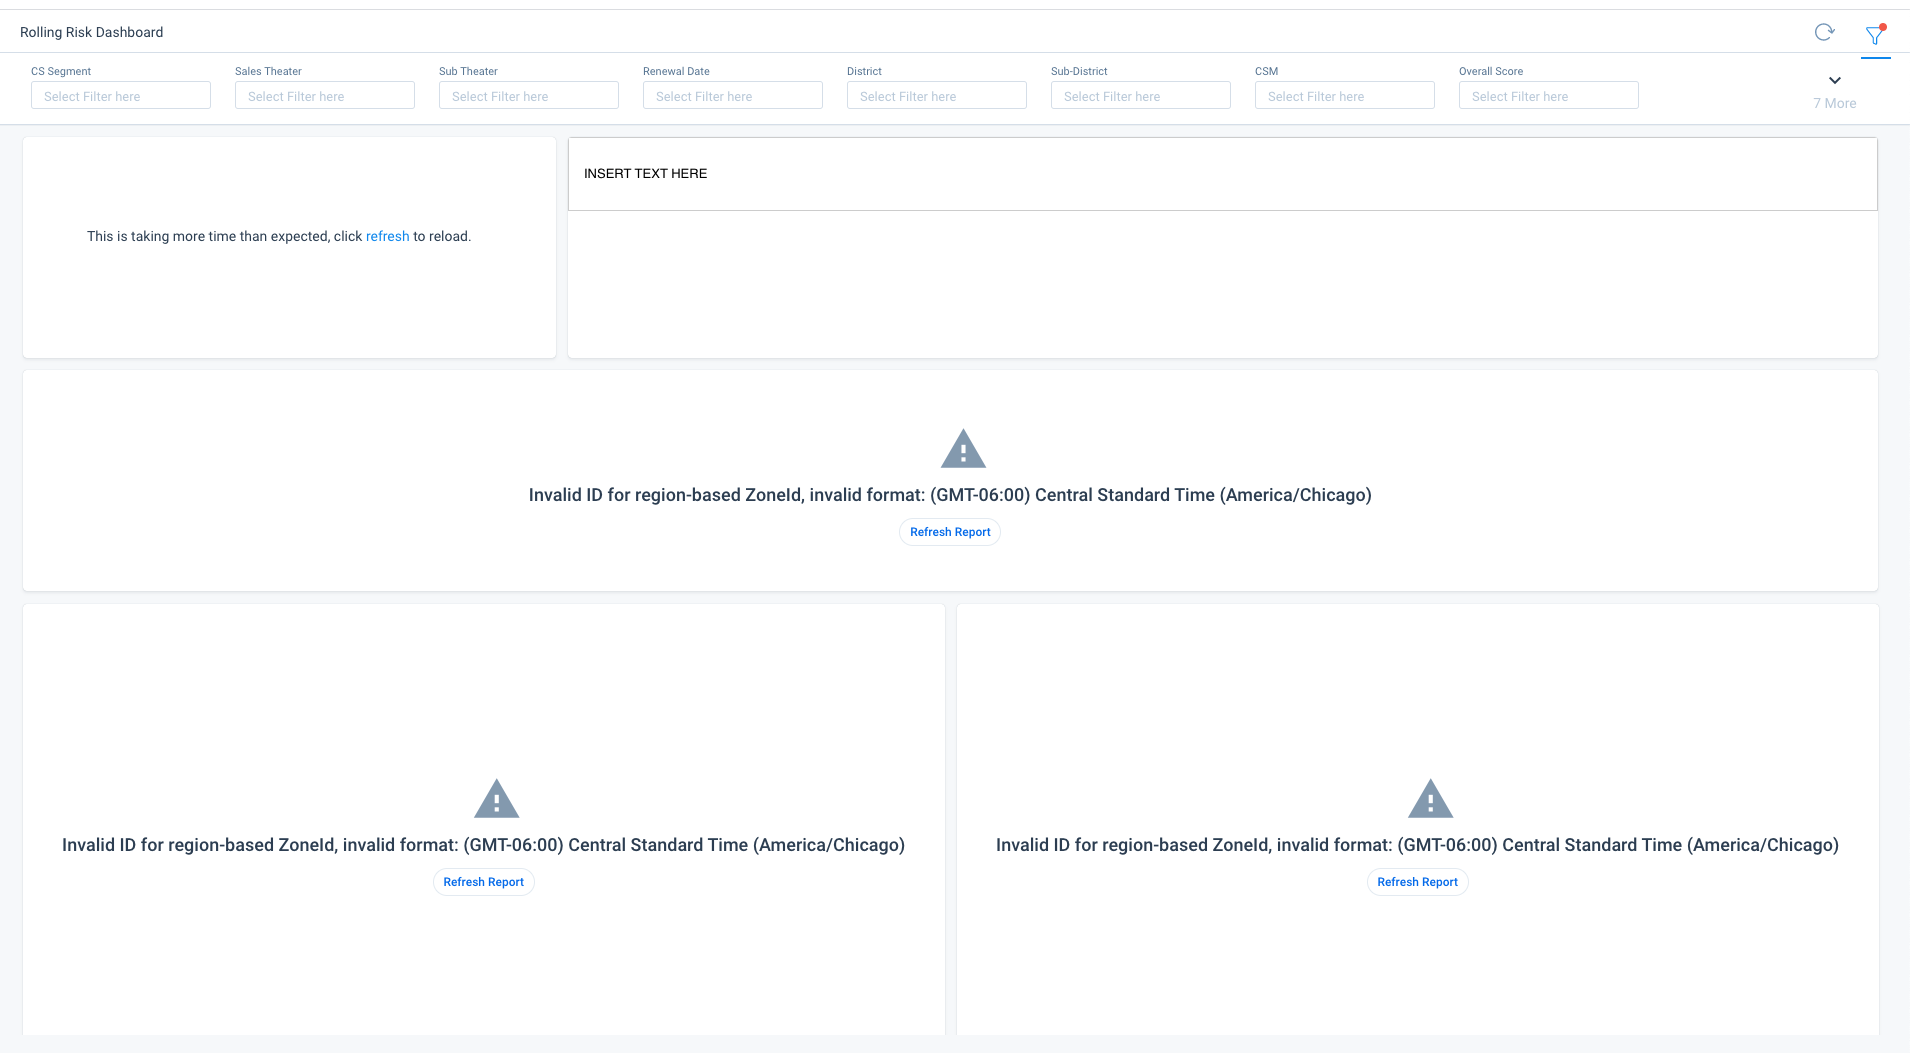
  3. When I share a dashboard via LINK, I get these errors when clicking through:
     
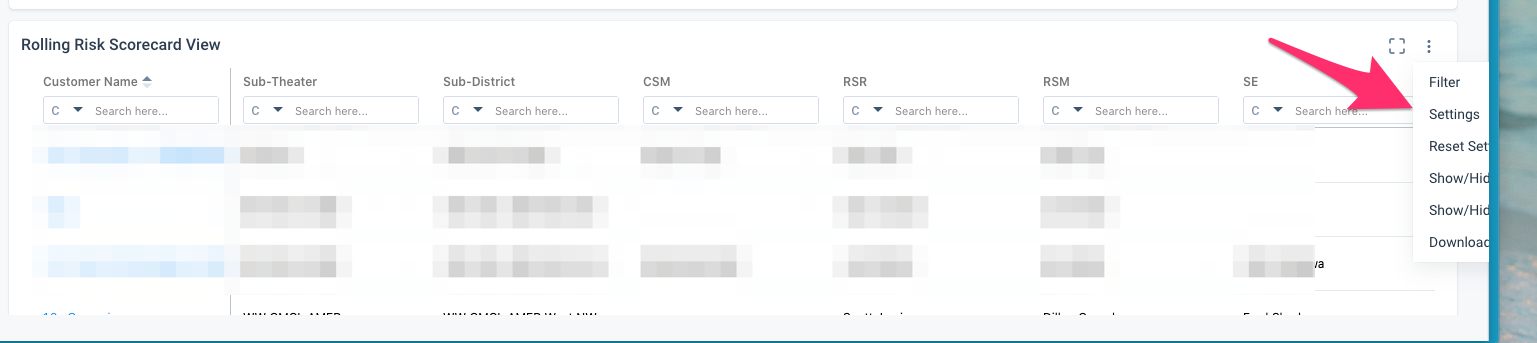
  4. Selecting the three dots on a report on the far right side of the window sometimes cuts off the options I can only see the full list when I expand the browser to Full Screen - this doesn’t happen all the time, only sporadically...
     

38 replies

shantan_reddy
Gainsight Employee ⭐️
March 16, 2021

@rakesh 

sai_ram
Expert ⭐️⭐️
March 16, 2021

@darkknight thank you for the feedback. Your feedback is always valuable for us.

bradley
Expert ⭐️
March 16, 2021

@darkknight I’ve got some related feedback here you might be interested in: 


darkknight
Expert ⭐️
March 16, 2021

I also have a chart that is built off of a Data Designer set that keeps giving me intermittent errors:


Jeff Kirkpatrick
rakesh
Gainsight Employee ⭐️
Lets put your data to work!
March 17, 2021

Hi Jeff, 

Thanks for the feedback . 

1 Custom Colors → This looks like a bug. We will look into it in detail. 
2 Drilldown Analyze → Currently its driven out of setting. You can turn it off or on. With end user reporting, this will fit in nicely where we evaluate if the user can analyze this dataset or not. 

3 This text is representative of caching. Report does not know the time of the data, it can be daily or weekly, etc. What this shows is the latest time the report hit the database and fetched the data. We are thinking of a toggle here to turn it off → I think this should solve the problem you are referring.

4 Looks like the other cream legend is null value. It looks like NA in older reporting and null values are being clubbed. We will need verify this further.

Gainsight Employee ⭐️
March 17, 2021

I also have a chart that is built off of a Data Designer set that keeps giving me intermittent errors:


@darkknight We have sent out a fix for this issue, can you check if you’re still facing this issue? 

darkknight
Expert ⭐️
March 17, 2021

Hi Jeff, 

Thanks for the feedback . 

1 Custom Colors → This looks like a bug. We will look into it in detail. 
2 Drilldown Analyze → Currently its driven out of setting. You can turn it off or on. With end user reporting, this will fit in nicely where we evaluate if the user can analyze this dataset or not. 

3 This text is representative of caching. Report does not know the time of the data, it can be daily or weekly, etc. What this shows is the latest time the report hit the database and fetched the data. We are thinking of a toggle here to turn it off → I think this should solve the problem you are referring.

4 Looks like the other cream legend is null value. It looks like NA in older reporting and null values are being clubbed. We will need verify this further.

Thanks Rakesh.  

#1 Need to have this resolved before we GA in Prod.

 #2 what is the setting that can be turned on/off? As noted in the post, I turned off all 3 General Settings in Report Builder and the Analyze Report persists.

#3 I understand it’s referring to caching - but the way it is worded will confuse end users. If you are not planning to have the toggle available when this GA’s in my production environment, then, before then, please change the wording so that it does not indicate that the data has been refreshed.

#4 Need to have this resolved before we GA in prod.


Jeff Kirkpatrick
darkknight
Expert ⭐️
March 17, 2021

I also have a chart that is built off of a Data Designer set that keeps giving me intermittent errors:


@darkknight We have sent out a fix for this issue, can you check if you’re still facing this issue? 

This seems to be corrected now thank you

Jeff Kirkpatrick
darkknight
Expert ⭐️
March 17, 2021

@rakesh Is the Dashboard Builder filter supposed to remain sticky?  It seems like it only remains sticky once:


  1. Open Dashboard Builder ; filter for something


  2. Select a Dashboard
  3. Exit Dashboard
  4. Filter is still sticky on the previously filtered selection.
  5. Select another Dashboard.
  6. Exit Dashboard.
  7. Sticky filter is gone.

Not a major issue, but seems like an inconsistency in the stickiness of the filter.


Jeff Kirkpatrick
darkknight
Expert ⭐️
March 18, 2021

@rakesh I keep adding additional items to the main post - please let me know if that is helpful or if you want them as comments/separate posts. Thanks

Jeff Kirkpatrick