
This article helps admins understand the KPI widgets and reports under the Engagement dashboard.
Overview
The Engagement dashboard is a powerful dashboard that provides clear insights into how customers interact with your community. Designed for community admins, customer success teams, and engagement analysts, it brings together key performance indicators (KPIs) and flexible filters to help you track company-level activity, identify trends, and monitor overall engagement.
Core metrics such as the percentage of monthly active customers, customer monthly activity, and lists of active or inactive customers give a complete picture of customer participation. These metrics help you quickly see which customers are engaging with your community and which may need attention.
By combining customer behavior metrics into an easy-to-use and filterable view, the Engagement dashboard helps you evaluate community health, strengthen relationships, and drive ongoing participation across your customer base.
Prerequisite: Salesforce Account Import integration is required.
The Engagement dashboard requires company data to show you customer analytics. To get this data into the Engagement dashboard, integrate Salesforce account to Customer Community.
For more information on how to import Salesforce Accounts, refer to How to Import Salesforce Account Data to CC article.
Global Filters
To support targeted analysis, the dashboard provides the following global filters:
- Date Filter: The Date filter applies to the creation dates of the content, as well as the timestamps of page views, likes given, and unique visitors who accessed the community.
Access and Manage the Engagement Dashboard
The Engagement dashboard is an out-of-the-box (OOB) dashboard that can be viewed from the Analytics page.
To view the dashboard:
- Log in to Control.
- Navigate to Analytics > New Dashboards.
- From the dropdown list, select Engagement dashboard. The Engagement dashboard appears.
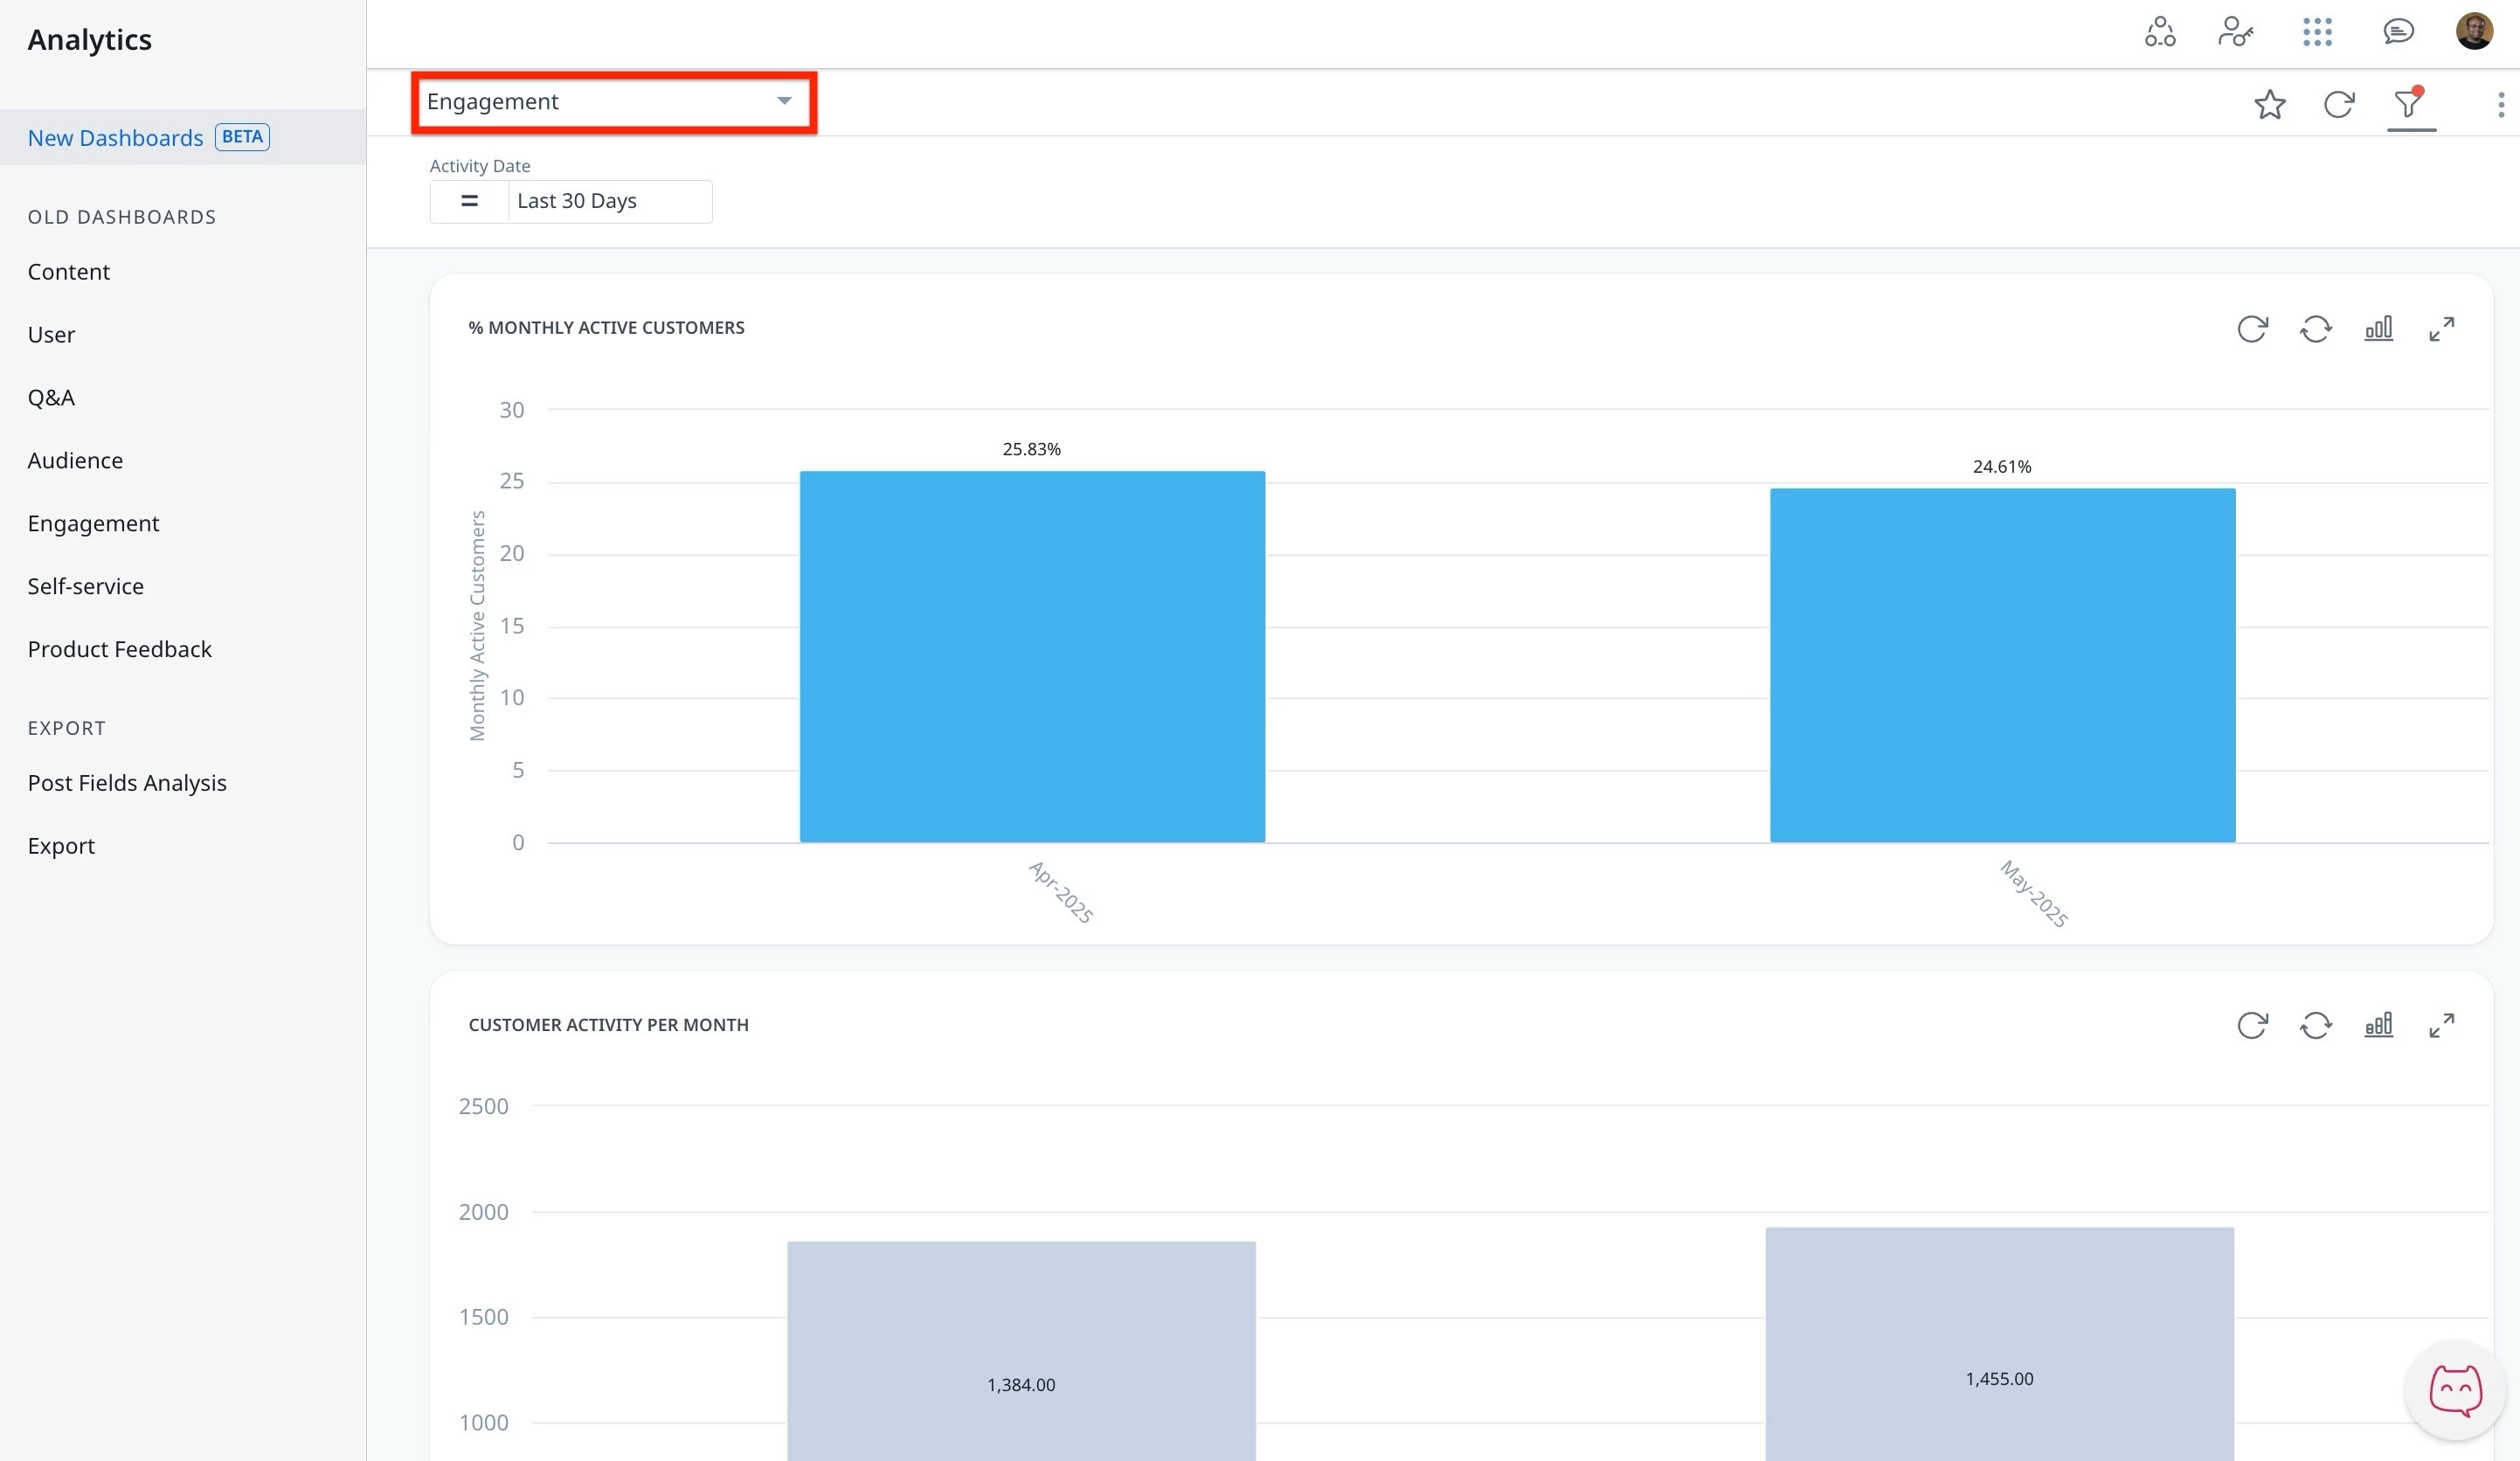
Admins can interact with and customize the dashboard using the global filter.
Note: The dashboard data is displayed in UTC.
For more information on how to customize Dashboards, Widgets, and Reports, refer to the Customize New Dashboards article.
Understand the Key Performance Indicators
To effectively use the Engagement dashboard and make informed decisions based on its insights, it is essential to first understand the key performance indicators (KPIs) it tracks. These KPIs are designed to measure how customers interact with your community, helping you understand engagement levels, participation trends, and the overall health of your customer base.
The Engagement dashboard focuses on customer interaction with the community. It highlights both active participation and signs of disengagement across your customer accounts. By tracking these indicators over time and comparing performance across periods, teams can quickly identify opportunities for outreach, recognition, or intervention.
The following sections describe each KPI available in the Engagement dashboard:
| KPIs | Description | Filter Exceptions and Note |
|---|---|---|
| % Monthly active customers | The percentage of active customers that had at least one user perform any activity (such as a page view, post, reply, or like) in the community within a given calendar month. | A customer or a company is considered active if at least one user assigned to the company executed at least one activity in the community, including a page view, and the company status was set as a customer. |
| Customer activity per month | The total number of companies where at least one user linked to the company had at least one page view in a given calendar month. | |
| Active customers | A detailed table listing companies that had at least one user engaged in the community during the selected period. The table provides metrics related to Unique visitors, Page views, Posts, Topics, Replies, and Likes given. | The Active Customers or Companies are defined as those where at least one user associated with the company has executed at least one activity, while the company's status is set to customer. IMPORTANT: Users are assigned to companies based on the contact field imported from SFDC. If a user is designated as a contact for multiple companies or accounts, their activity will be reflected in all associated companies. This may result in duplicated figures for some users. Therefore, the accuracy of SFDC data and the unique assignment of contacts to their respective accounts are essential for maintaining data integrity in this dashboard. |
| Inactive customers | Displays customers that had no user activity during the selected period. | Filters: The Date filter applies to all user activities in the community. |
Note: If you want to calculate these KPIs using data from the CC Data Lake, refer to the Engagement Dashboard KPIs – Query Reference for CC Data Lake article.
How User Assignments Impact Company Engagement Metrics
Company engagement is calculated by attributing user activity to the company the user was assigned to at the time the activity occurred. This ensures that the engagement metrics reflect an accurate historical view of user contributions tied to their actual company affiliation during that period. Rather than using a user's current or most recent assignment, which may change over time, this approach anchors each activity to the user's assignment at the moment of execution. This method provides a more reliable and consistent way to assess how user actions contribute to company performance.
Dashboard Behavior (Old and New)
The old and new dashboards both attribute user activity to the company assigned to a user at the time of the activity. However, they differ in how they calculate engagement:
- Old dashboards: Count view activities based on simple pageview events.
- New dashboards: Retroactively link past pageview events to users using the same session ID, even if the user was a guest at the time. This can significantly increase the number of past views attributed to registered users.
Additionally, a corrected query in the new dashboards changes how total active companies are calculated, which affects all related metrics.
Limitations:
- In Salesforce, users can be assigned to multiple companies simultaneously.
- When this occurs, a single activity can be counted multiple times, once for each company assignment.
- This leads to inflated engagement numbers because the same user activity is reported across multiple companies.
- Retroactive event linking in the new dashboards can over-attribute past guest activity to registered users, further increasing reported engagement.