This article helps community managers understand the KPI widgets and reports under the Product Feedback dashboard.
Overview
The Product Feedback dashboard provides a comprehensive view of your team's performance in delivering community-submitted ideas and managing user expectations. By monitoring the number of ideas created and vote dynamics, community managers can assess the effectiveness of ideation efforts, identify gaps in delivery, and maintain user trust.
Additionally, the Company filter in the dashboard is a key feature for analyzing a company's engagement with the platform's ideas. This filter allows users to see ideas created by a specific company or those they have interacted with through voting, replying, or viewing within a specified timeframe. This level of analysis provides insight into a company's engagement and influence on ideation trends over a specified period.
Global Filters
To support targeted analysis, the dashboard provides the following global filters:
- Activity Date: The Date filter applies globally across KPIs, adapting to each metric. It filters delivered ideas by the delivery status change date and includes delivered votes up to that point. For converted conversations, it uses the like time as the vote time. It also filters by vote creation, idea or topic creation, and engagement activity within the selected period, adjusting for calendar month views where needed.
- Company: The Company filter applies globally across KPIs and adjusts based on context. It filters ideas delivered or with changed status based on votes or submissions by selected companies. It includes votes added or delivered by the community user
companies, and engagement metrics like views, votes, and replies. For idea creation and submission, only the submitter company is considered, not the company's votes.
Note: The company filter is available only if you have the Salesforce Integration enabled to link community members to their organization.
The Product Feedback dashboard shows how well you are delivering on the ideas that your users vote for and submit. To use this dashboard, as a prerequisite, you have to configure ideation statuses before continuing.
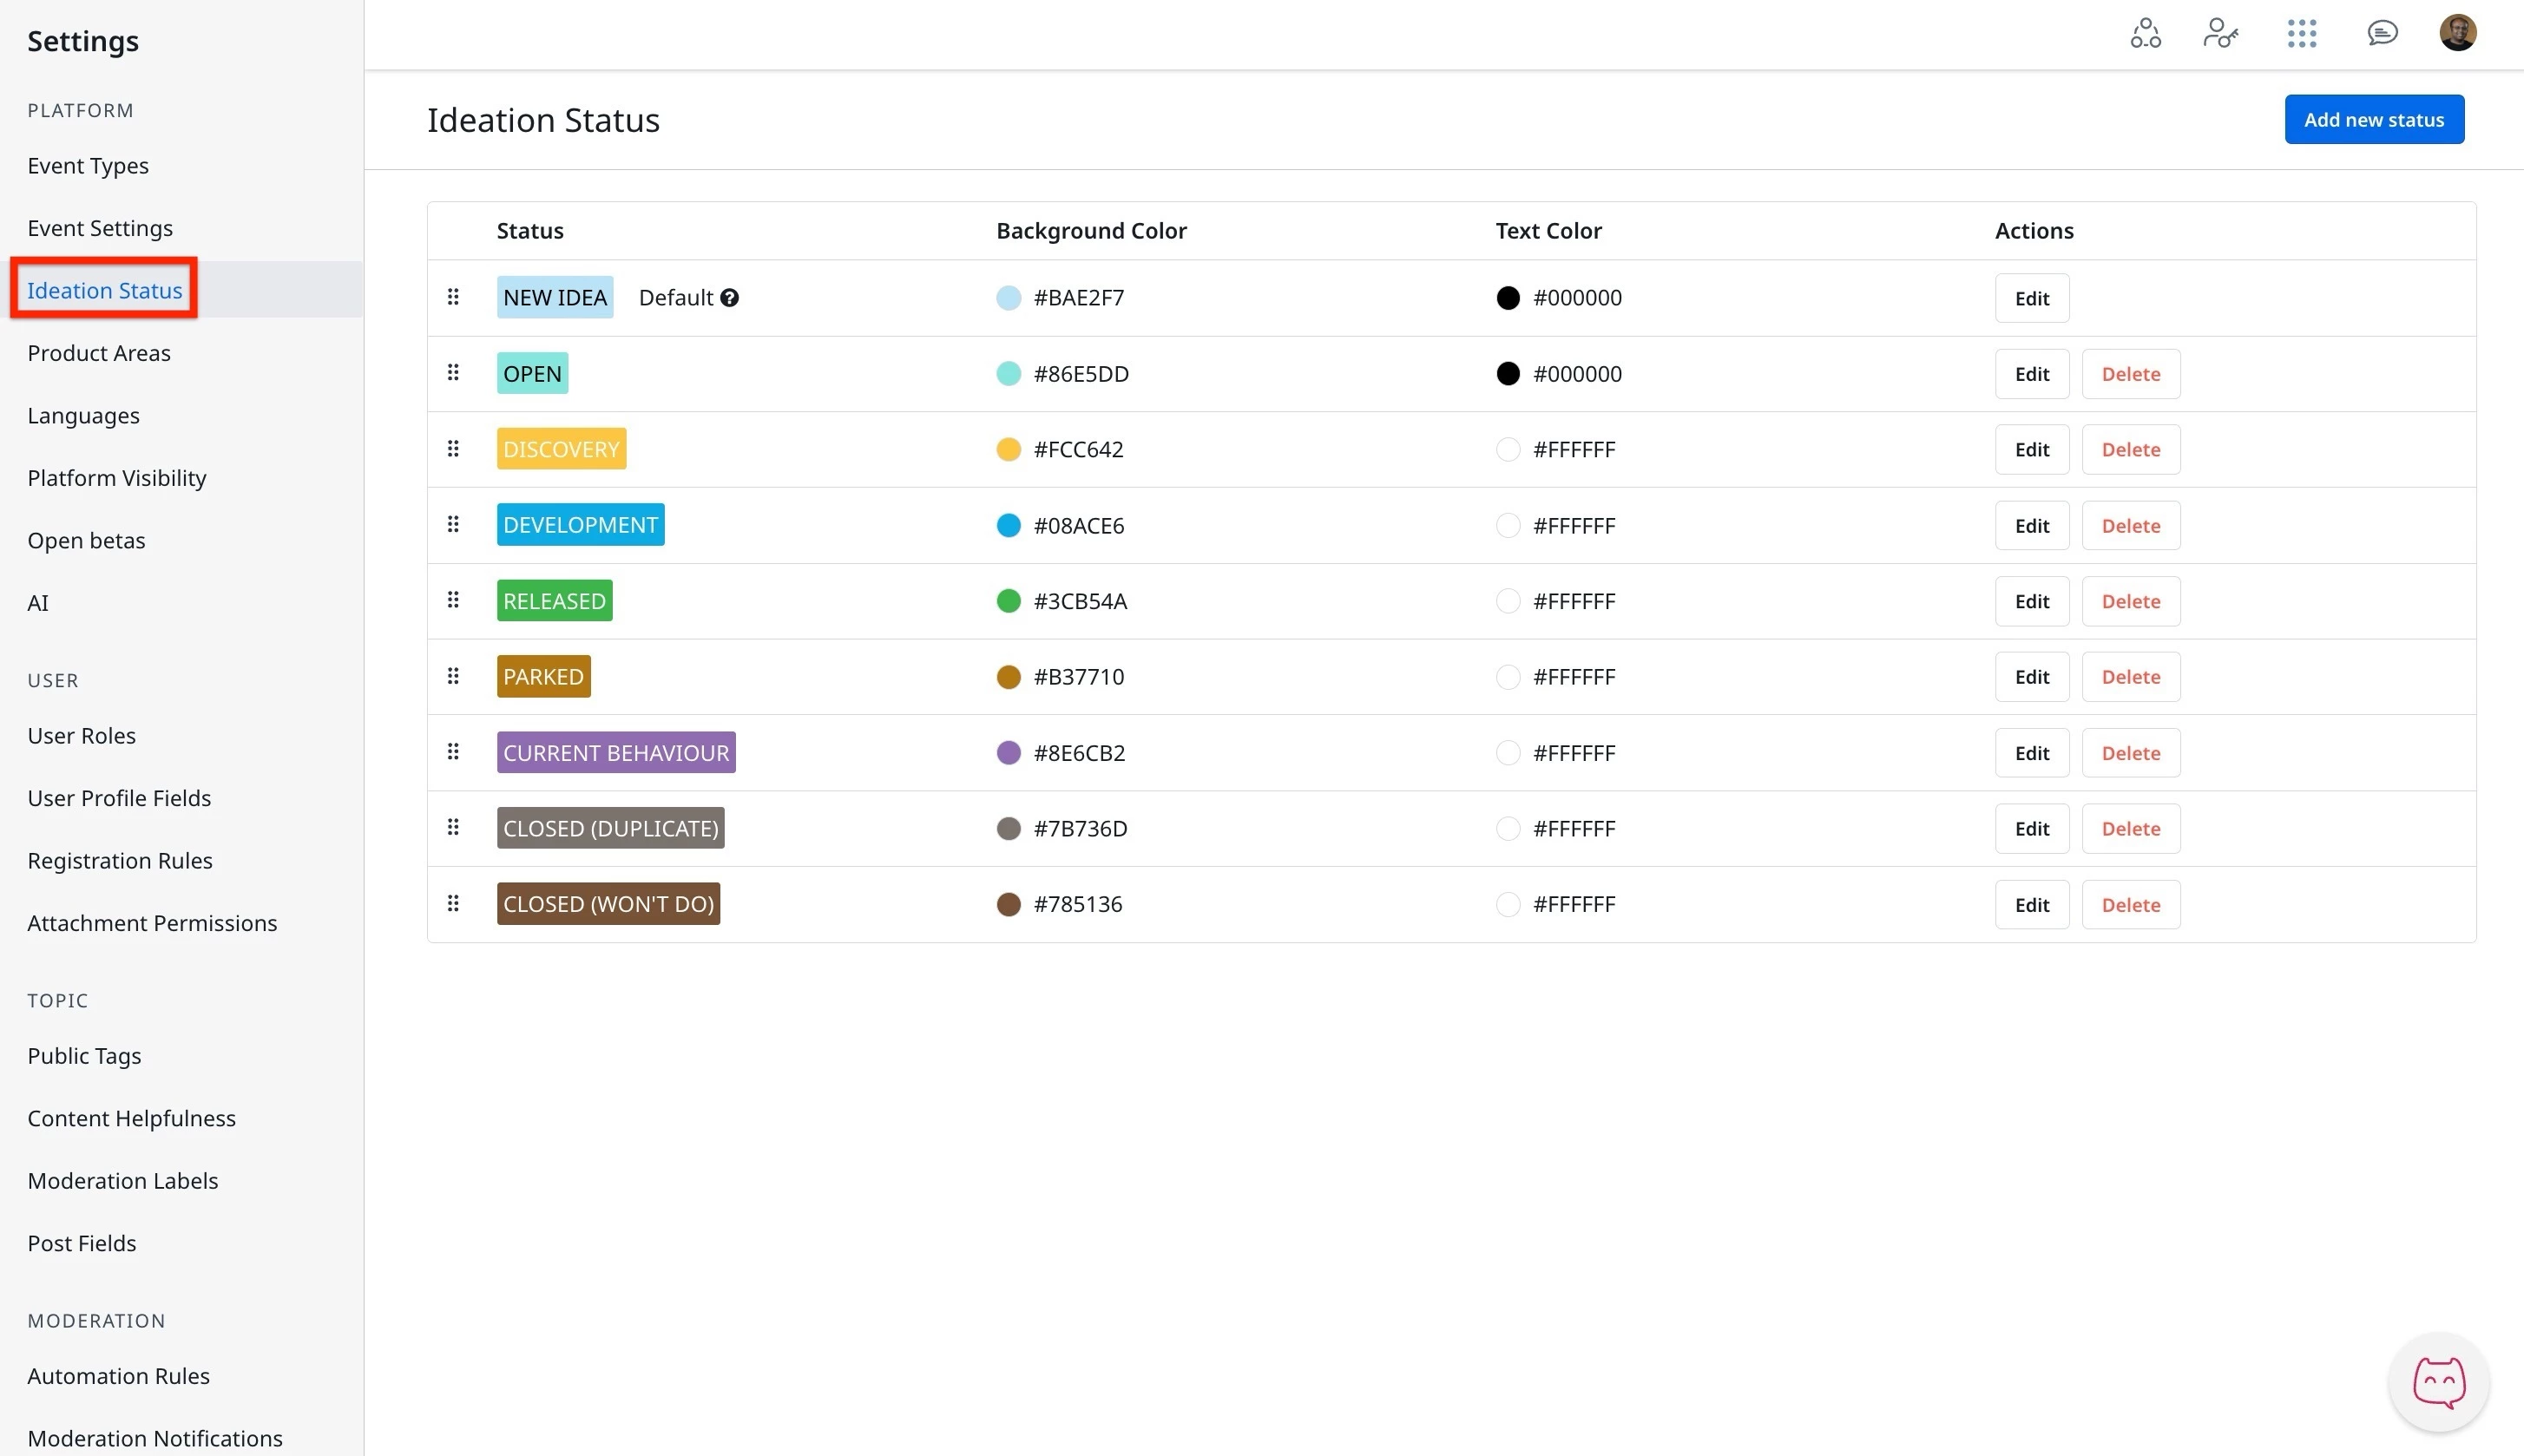
To configure the idea status:
- Log in to Control.
- Navigate to Control > Settings > Ideation Status.
- Click Add new status. The Add new status dialog appears.
- Perform the following actions:
- Enter Status Name
- Select a Background Color
- Select Text Color
- Click Save.
Access and Manage the Product Feedback Dashboard
The Product Feedback dashboard is an out-of-the-box (OOB) dashboard that can be viewed from the Analytics page.
To view the dashboard:
- Log in to Control.
- Navigate to Analytics > New Dashboards.
- From the dropdown list, select Product Feedback Dashboard. The Product Feedback dashboard appears.
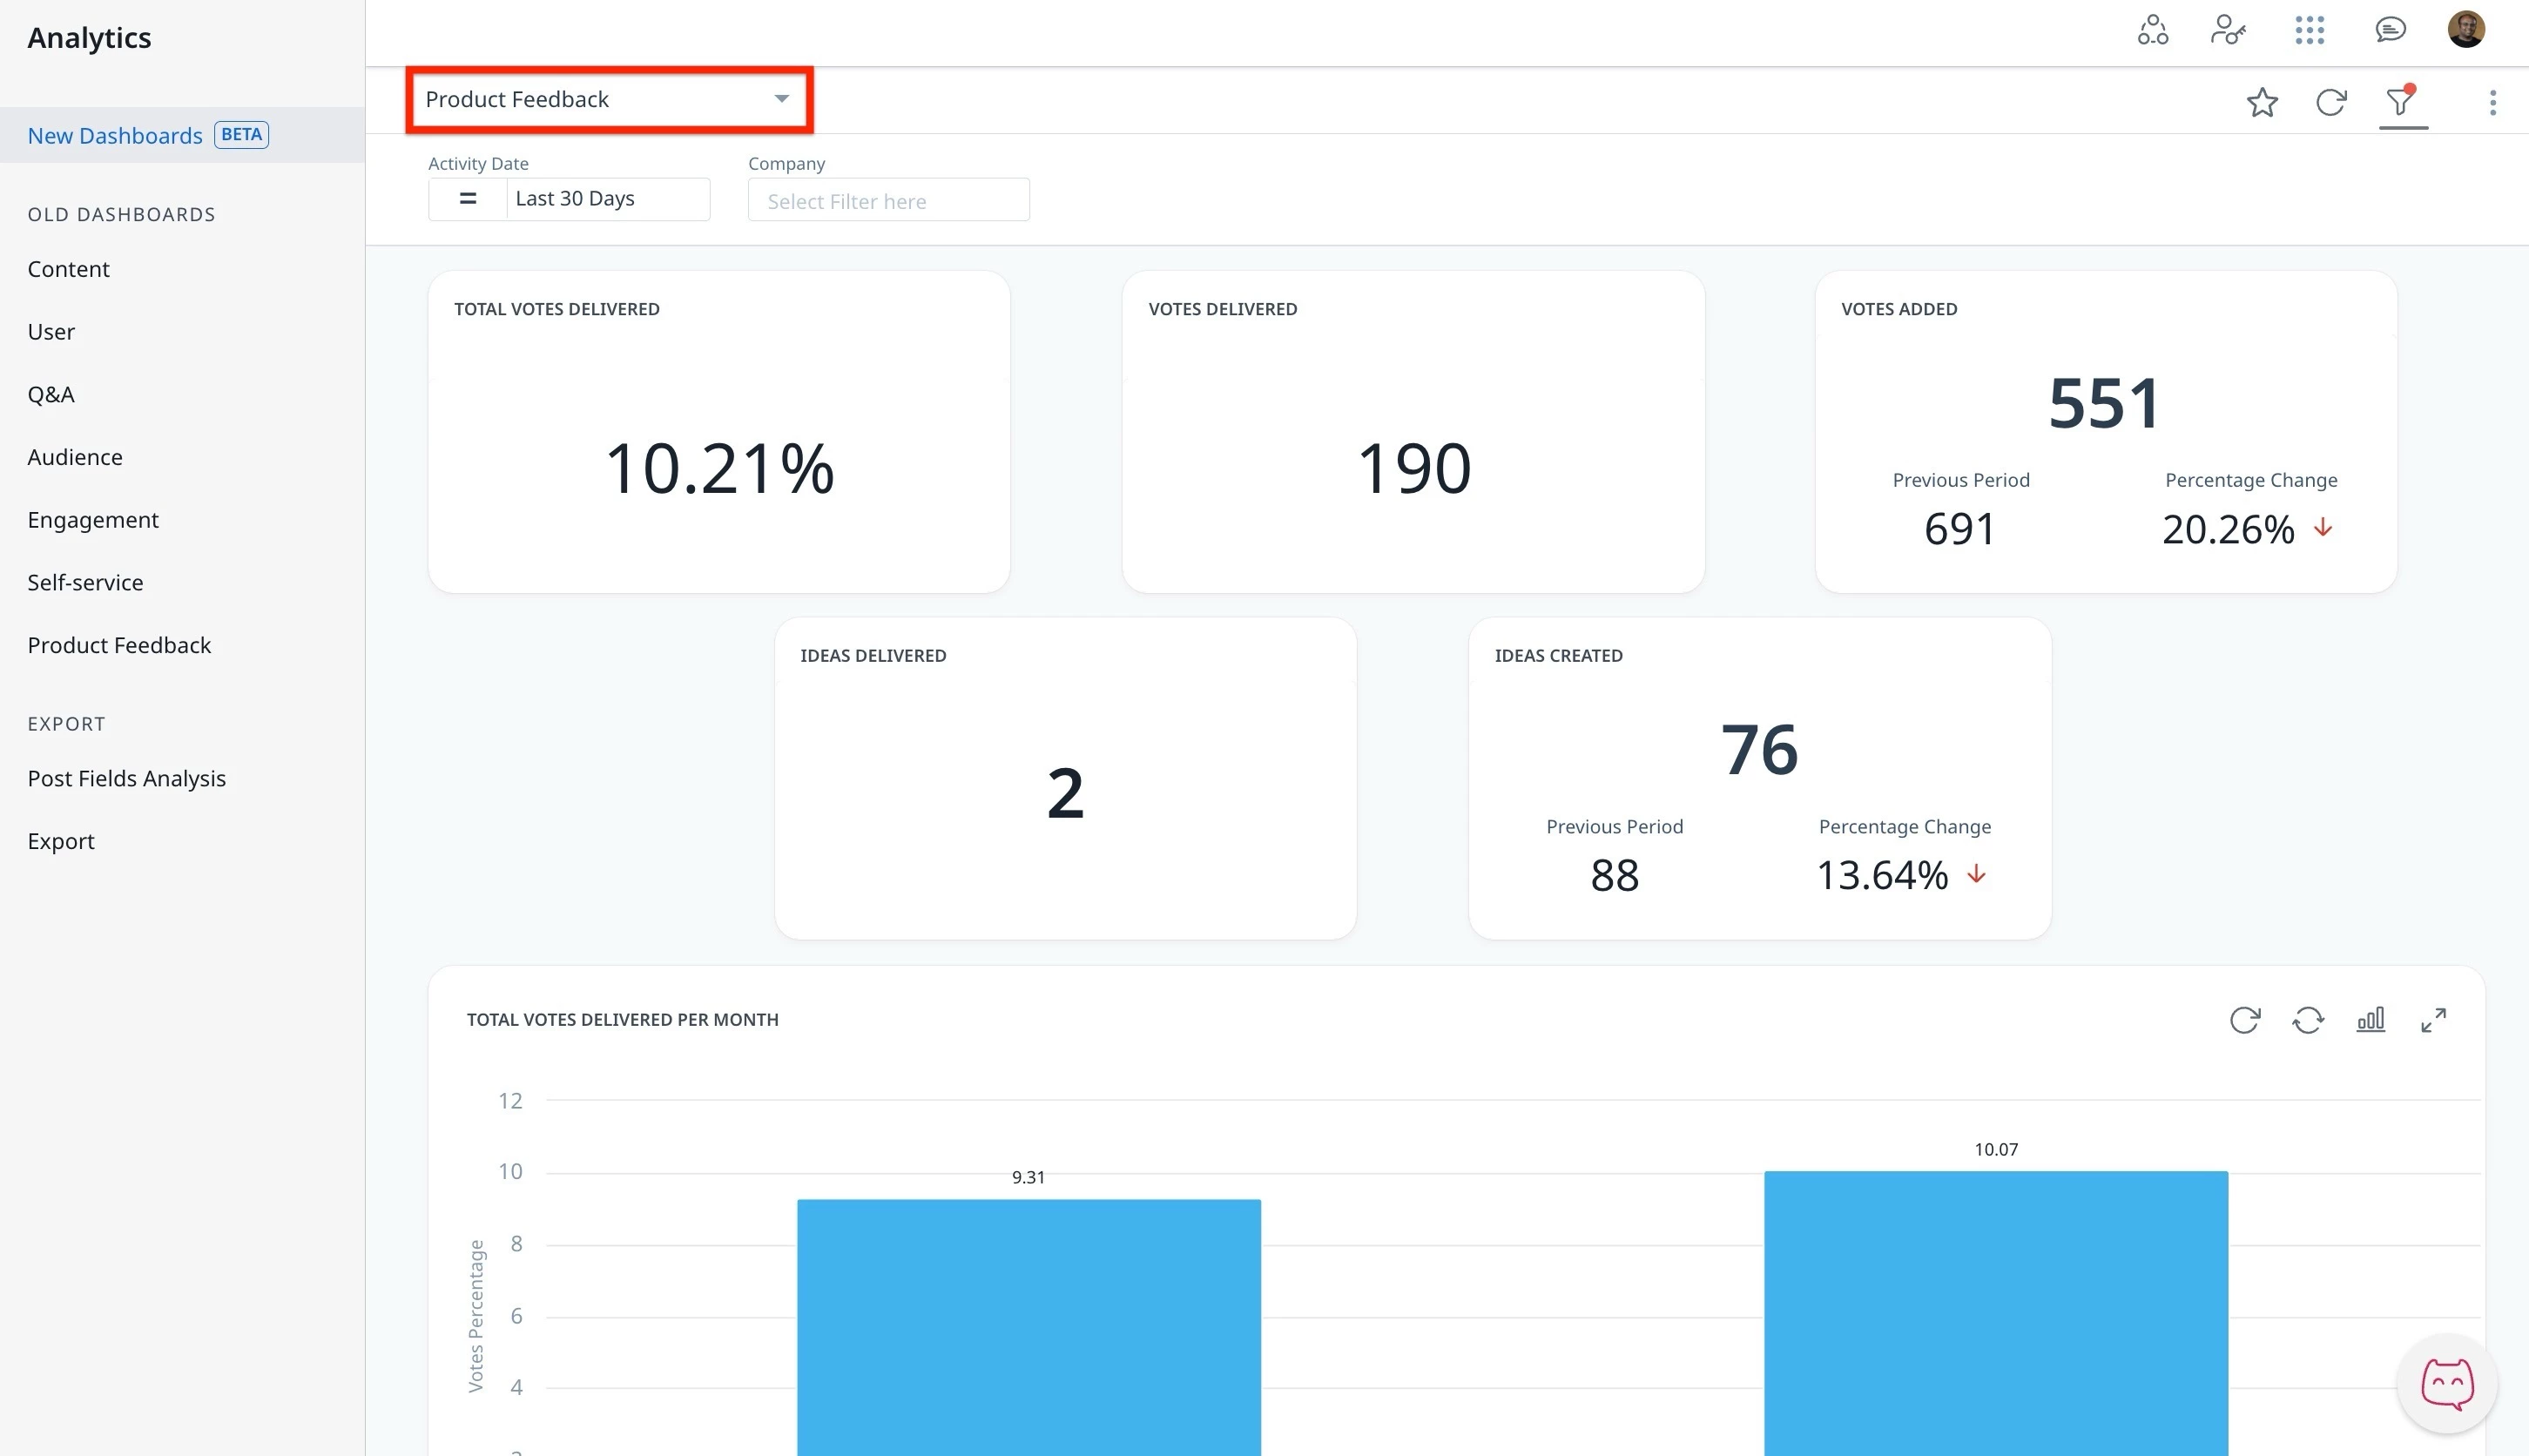
Community managers can interact and customize the dashboard using features such as global and individual filters, report visualization options, and more.
Note: The dashboard data is displayed in UTC.
For more information on how to customize Dashboards, Widgets, and Reports, refer to the Customize New Dashboards article.
Understand the Key Performance Indicators
To make the most of the Product Feedback dashboard and accurately understand how well you are meeting user expectations, it is essential to understand the key performance indicators (KPIs). The Product Feedback dashboard’s metrics help track ideation volume, voting trends, Ideas delivered, and Ideation trends. These KPIs provide critical insight into how effectively user-submitted ideas are being managed, from submission through delivery.
% Period to Period Change and Previous Period
Users are equipped to understand performance shifts through the % Period to Period Change and Previous Period metric, which provides a clear comparison over matching timeframes.
These metrics are provided in each KPI widget.
% Period to Period Change
This metric shows how a Key Performance Indicator has increased or decreased over time. It compares two time periods of the same length to give a fair and clear view of performance changes. For example, if you select the last 15 days, it compares them to the 15 days right before that.
Previous Period
The previous period is always the same number of days as the time period you choose. If you select April (30 days), the system looks at the 30 days just before April, not the full month of March. This helps make sure the comparison is even and accurate.
IMPORTANT: To filter users at a company level, Salesforce Account Import integration is required.
The Product Feedback dashboard requires company data to show you customer analytics. To get this data into the product dashboard, integrate a Salesforce account with Customer Communities.
For more information on how to import Salesforce Accounts, refer to How to Import Salesforce Account Data to CC article.
KPI Descriptions
The following table describes each KPI, along with any specific exclusions or filters apart from the ones mentioned below.
Common Exclusions:
- Votes from trashed ideas are excluded across all vote-related KPIs.
- Votes with closed status are excluded from KPIs calculating delivery percentages.
- Trashed ideas are excluded from idea-related KPIs.
- Duplicate votes from merged ideas are excluded. Only one vote is counted if the same user voted on both merged ideas.
- Unvotes are excluded from the final vote count to reflect actual engagement.
| KPIs | Descriptions | Filter Exceptions and Notes |
|---|---|---|
| % Total Votes Delivered | Measures the percentage of votes associated with delivered ideas up to the end of the selected time relative to all votes cast on ideas since the community's inception. | |
| Votes Delivered | Represents the total number of votes associated with ideas that have been delivered within the selected period. When a conversation is converted into an idea, all its likes are converted into votes and added to the count. Importantly, the same vote is never counted twice in the Votes Delivered metric; for example, if an idea changes status ( from delivered to open and back to delivered) within the selected date range, the votes are counted only once as being delivered. | |
| Votes Added | The number of votes added to ideas within the selected period. This includes votes from conversations that have been converted into ideas, where likes are turned into votes based on the time of the like, provided they occurred during the selected timeframe. If a user unvotes an idea, that vote is excluded from the final count, ensuring the KPI reflects final engagement. Additionally, if two ideas are merged and the same user votes on both, only one vote is counted to avoid duplication. | |
| Ideas Delivered | The number of unique ideas that have been delivered within the selected time. Each idea is counted only once, regardless of any status changes it may undergo. For example, if an idea changes status (e.g., from delivered to open and back to delivered) during the selected timeframe, it will still be counted as delivered only once, with the final status being assessed at the end of the selected time. | |
| Ideas Created | The total number of unique ideas submitted within the selected time. This KPI includes not only original ideas but also conversations that have been converted into ideas, if the topic was created in the selected timeframe. | |
| Total votes delivered per month | The percentage of cumulative total votes delivered at the end of each calendar month, excluding closed votes. It is calculated using the cumulative counts of open and delivered votes as of the last day of each month and the last day specified in the Date filter. Calculation: cumulative delivered votes / (cumulative delivered votes + cumulative open votes) | |
| Total Votes | The chart represents the cumulative total of open, delivered, and closed votes over time, displayed on a daily interval. | Note: When a conversation is converted into an idea, the total count of its likes is converted into votes, with the like time becoming the vote time, and these are added to the overall vote count. |
| Ideation Trend Table | The table displays a list of ideas raised in the community, organized by the number of new votes, with the number of new replies or new views that occurred during the selected timeframe. Ideas are linked to the company assigned to the author at the time of creation. Votes, replies, and views are also tied to the user's company at the time the activity happened. When you filter by a company, the table shows how many of these activities came from that company compared to the total. |
Company Attribution and Data Accuracy in the Product Feedback Dashboard
Understanding how user activities are attributed to companies is key to interpreting engagement data accurately. This section outlines how the Product Feedback Dashboard handles company attribution and highlights improvements over earlier dashboard versions.
Activity Attribution Logic
The new Product Feedback dashboards provide a more contextually accurate view of company engagement by linking user activities, such as idea creation, voting, replying, or viewing, to the company associated with the user at the exact time the activity occurred. This approach contrasts with legacy dashboards, which calculated engagement based on the most recent company assignment at the time of report generation. Such a method could potentially lead to misleading metrics if users changed company affiliations over time.
One of the key differences between the old and new dashboards is the handling of metrics adjustments. The old dashboard did not account for events such as idea resets and idea merges, whereas the new dashboard includes these factors in its calculations. Additionally, topic conversions are now tracked in the new dashboard. When a topic converts to an idea, all its likes are turned into votes, potentially resulting in significant differences in dashboard metrics.
Activity attribution in the dashboards has also changed. In the old dashboards, if a user performed an activity like voting on an idea, the activity was credited to their current company. In contrast, the new dashboards attribute the activity to the company the user belonged to at the time of the action. This shift ensures a more accurate representation of company engagement over time.
Furthermore, the treatment of voting records in the dashboards differs. The old dashboard tracked all votes for each idea daily, while the new dashboards maintain records only of the current vote count. This change affects all Key Performance Indicators (KPIs) related to votes. Lastly, view-related differences exist between the old and new dashboards, with the former relying on simple page views to attribute views to companies, leading to discrepancies in the number of page view events recorded.
Multiple Company Assignments
In Salesforce environments, users can be assigned to multiple accounts. In both the old and new dashboards, this can lead to inflated metrics, as user activity may be counted once per company assignment.
Company Filter in the Ideation Trend Table
When using the Company filter in the Ideation Trend Table:
- You see ideas created by users from the selected company.
- You also see any ideas where company users have voted, replied, or viewed content.
These interactions are displayed only if they occurred within the date range specified by the Date filter, enabling detailed insight into company-level engagement trends over time.
Limitations
- Idea Merging: A single idea can be merged multiple times, affecting count accuracy.
- Post-Delivery Voting: Delivered or closed ideas can still receive votes, which may influence metrics.
- Data Migration: If you’ve migrated from another ideation platform:
- Idea creation and voting dates are preserved if available.
- Status change dates are inferred using the Last Updated At timestamp.
- If critical data is missing, ideas and votes may appear as created on the migration date with their current status.