This article helps community managers understand the KPI widgets and reports under the Self-Service dashboard.
Overview
Self-Service dashboard helps you to evaluate how effectively your help content empowers customers to resolve issues independently, without submitting support tickets. By integrating Zendesk ticket data, this dashboard provides a measurable self-service score, which reflects the percentage of users who find answers through help resources rather than direct support interactions.
Key Benefits:
- Visualizes Customer Self-Sufficiency: See how many users solve issues via help articles instead of tickets.
- Tracks Helpdesk Trends: Understand if help content is reducing your team’s ticket volume.
Self-Service Score Metrics
The Self-Service score is the core metric of the Self-Service Dashboard. It measures how well your help content supports users in solving issues without contacting your support team.
A strong self-service score means users are:
- Finding answers quickly
- Having a smoother experience
- Less reliant on support agents
The self-service score is calculated by dividing the Total unique visitors who viewed help content by the Total Zendesk unique users who submitted support tickets.
For example, if 1,000 users viewed help content and 250 created tickets, your self-service score is 4.0.
Global Filters
To support targeted analysis, the dashboard provides the following global filters:
- Date: The Date filter helps in identifying KPIs of Self-Service score, unique users who created tickets, unique visitors who viewed help content and other widgets within the select date.
- Published In: The Published In filter applies to the most recent category or group update. If the content has been moved between categories over time, only the last or current category or group is considered.
- Content Type: The Content Type filter applies to the most recent content type update. If the content type has changed over time, only the last or current content type is considered.
- Primary User Role: The Primary User Role filter applies to the most recent role update. If the author's user role has changed over time, only the last or current role is taken into account.
- Custom User Role: The Custom User Role filter applies to the most recent role update. If the author's user role has changed over time, only the last or current role is taken into account.
Zendesk Integration Required
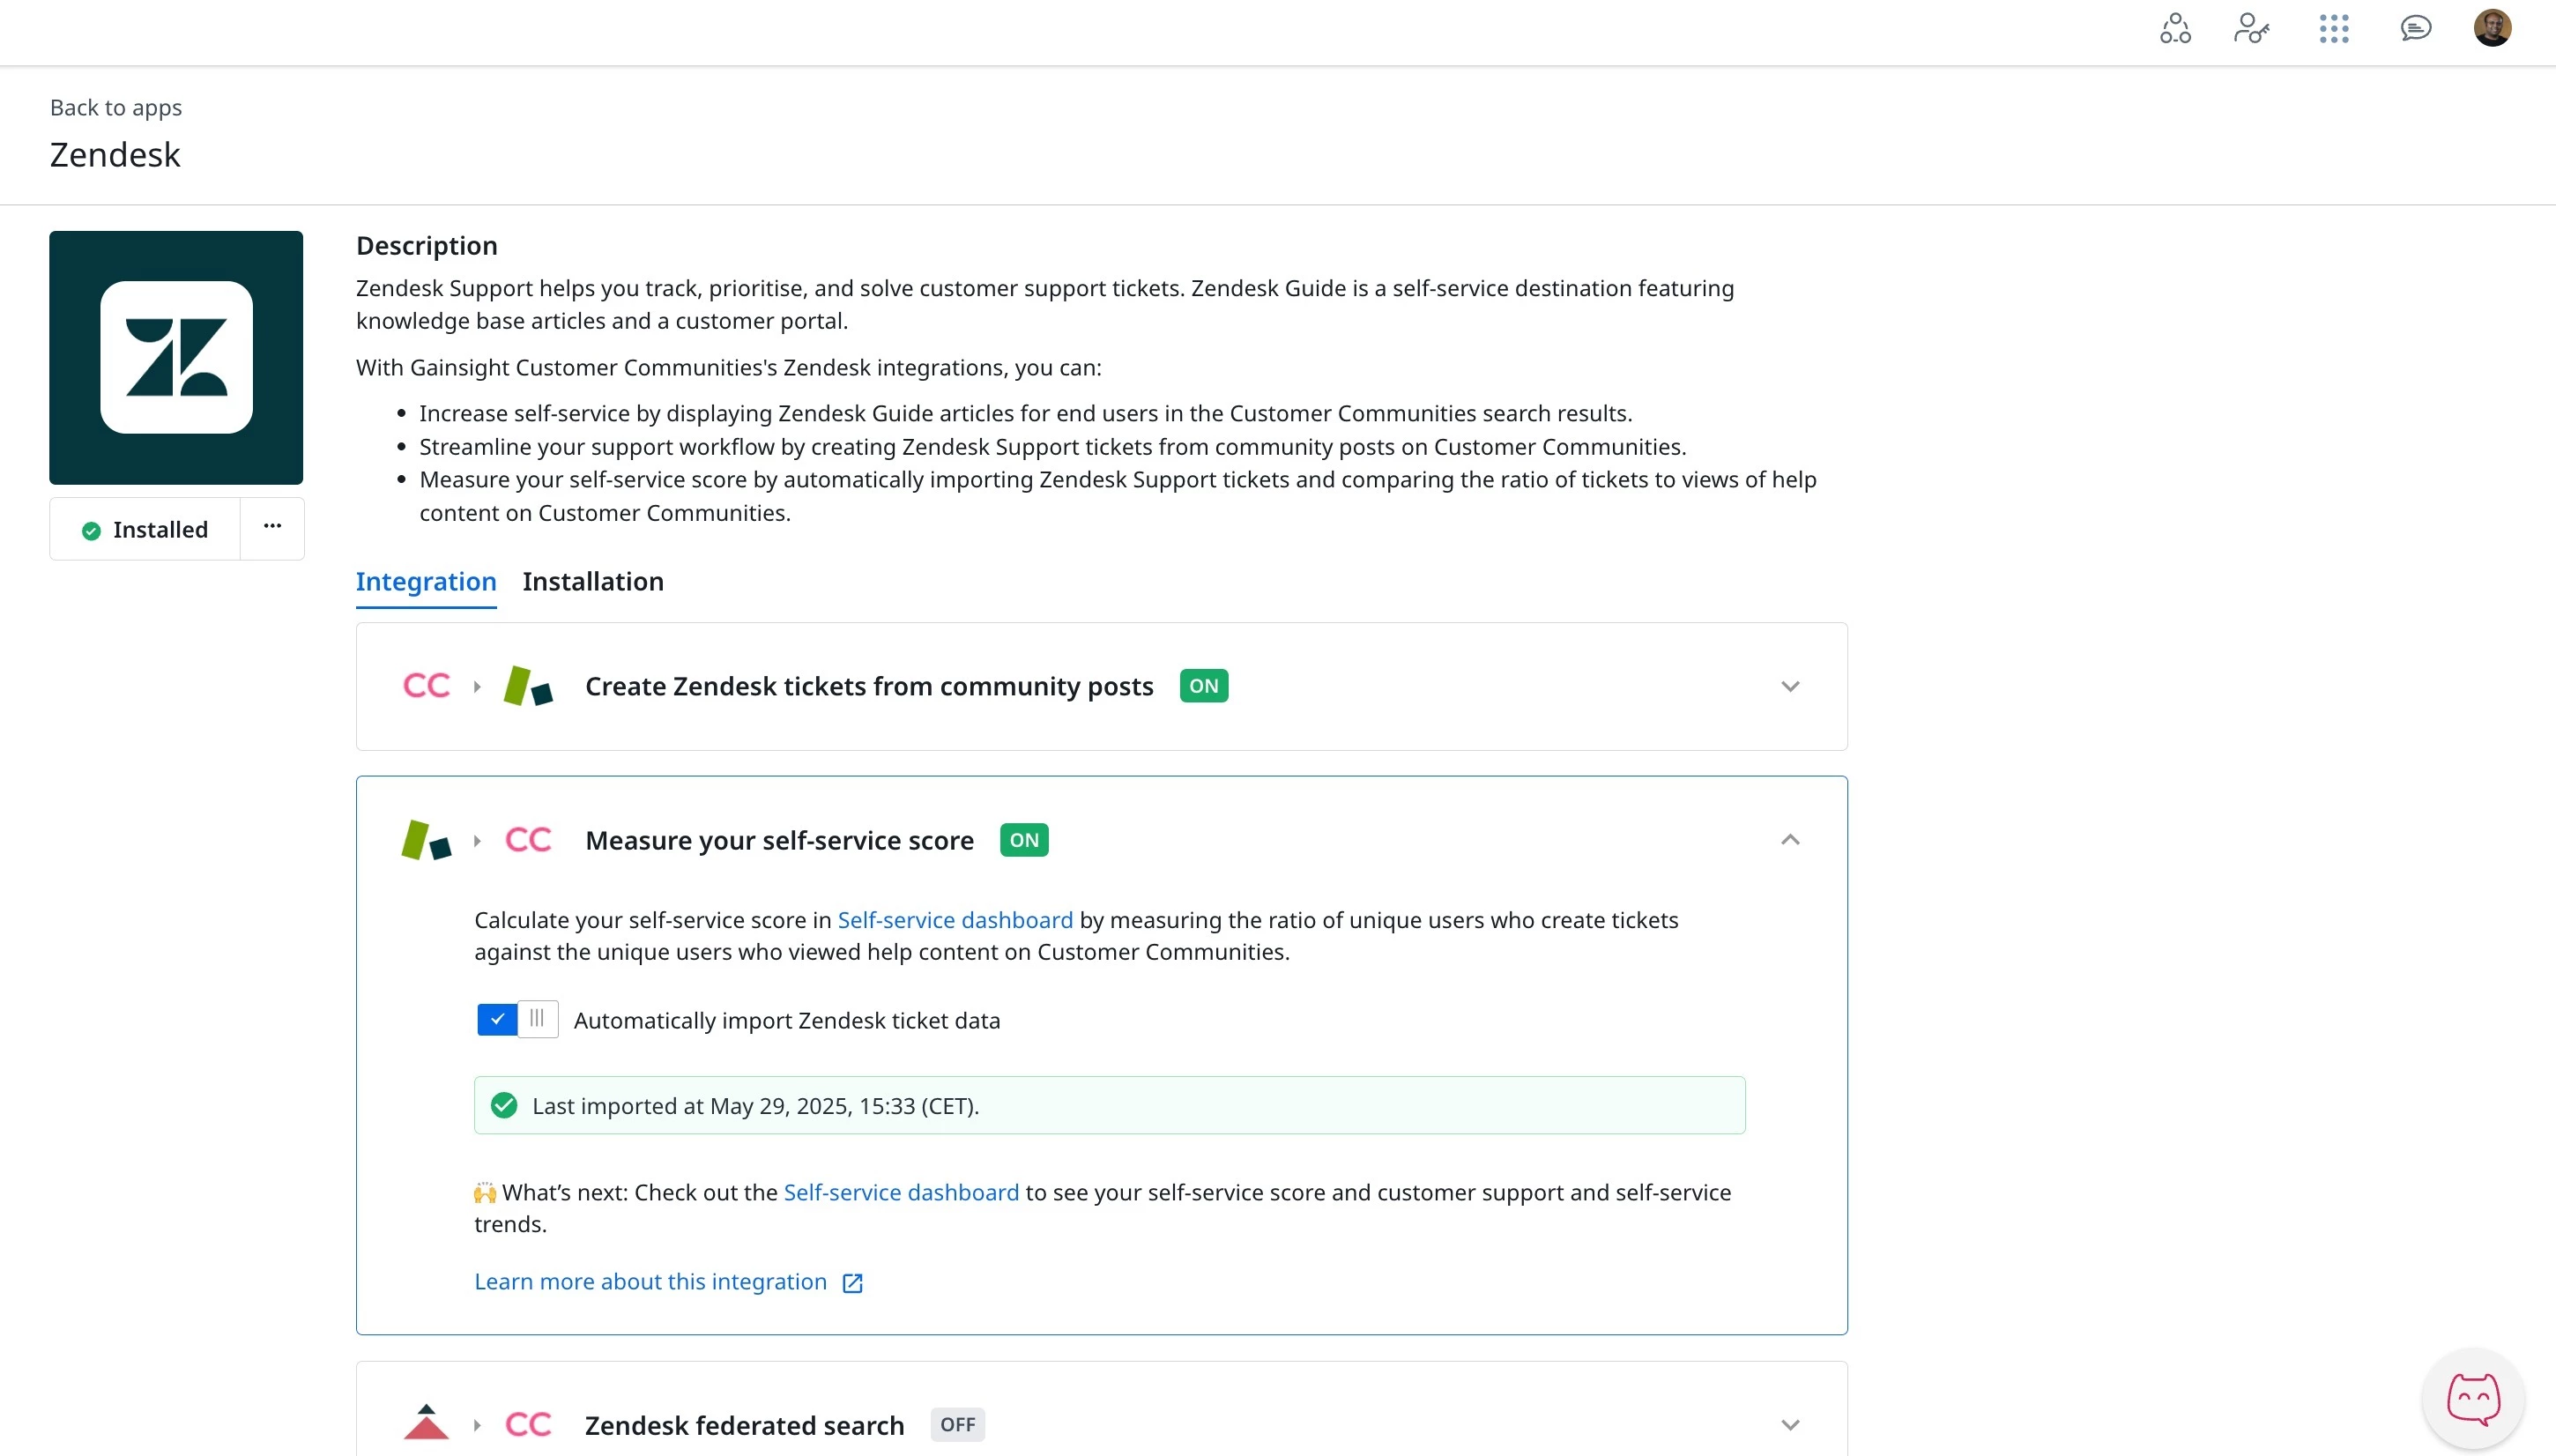
To activate the dashboard, you need to connect your Zendesk account and enable automatic ticket data imports. The integration pulls approximately three months of historical ticket data and continues to update hourly.
For more information on how to connect to Zendesk, refer to How to Install the Zendesk x CC Integrations article.
Import Data into Self-Service Dashboard
For the Self-Service dashboard data to be available, you must import the data from Zendesk. To import Zendesk data:
- Log in to Control.
- Navigate to Control > Integrations > Zendesk.
- Expand Measure your self-service score.
- Toggle Automatically import Zendesk ticket data to start importing data.
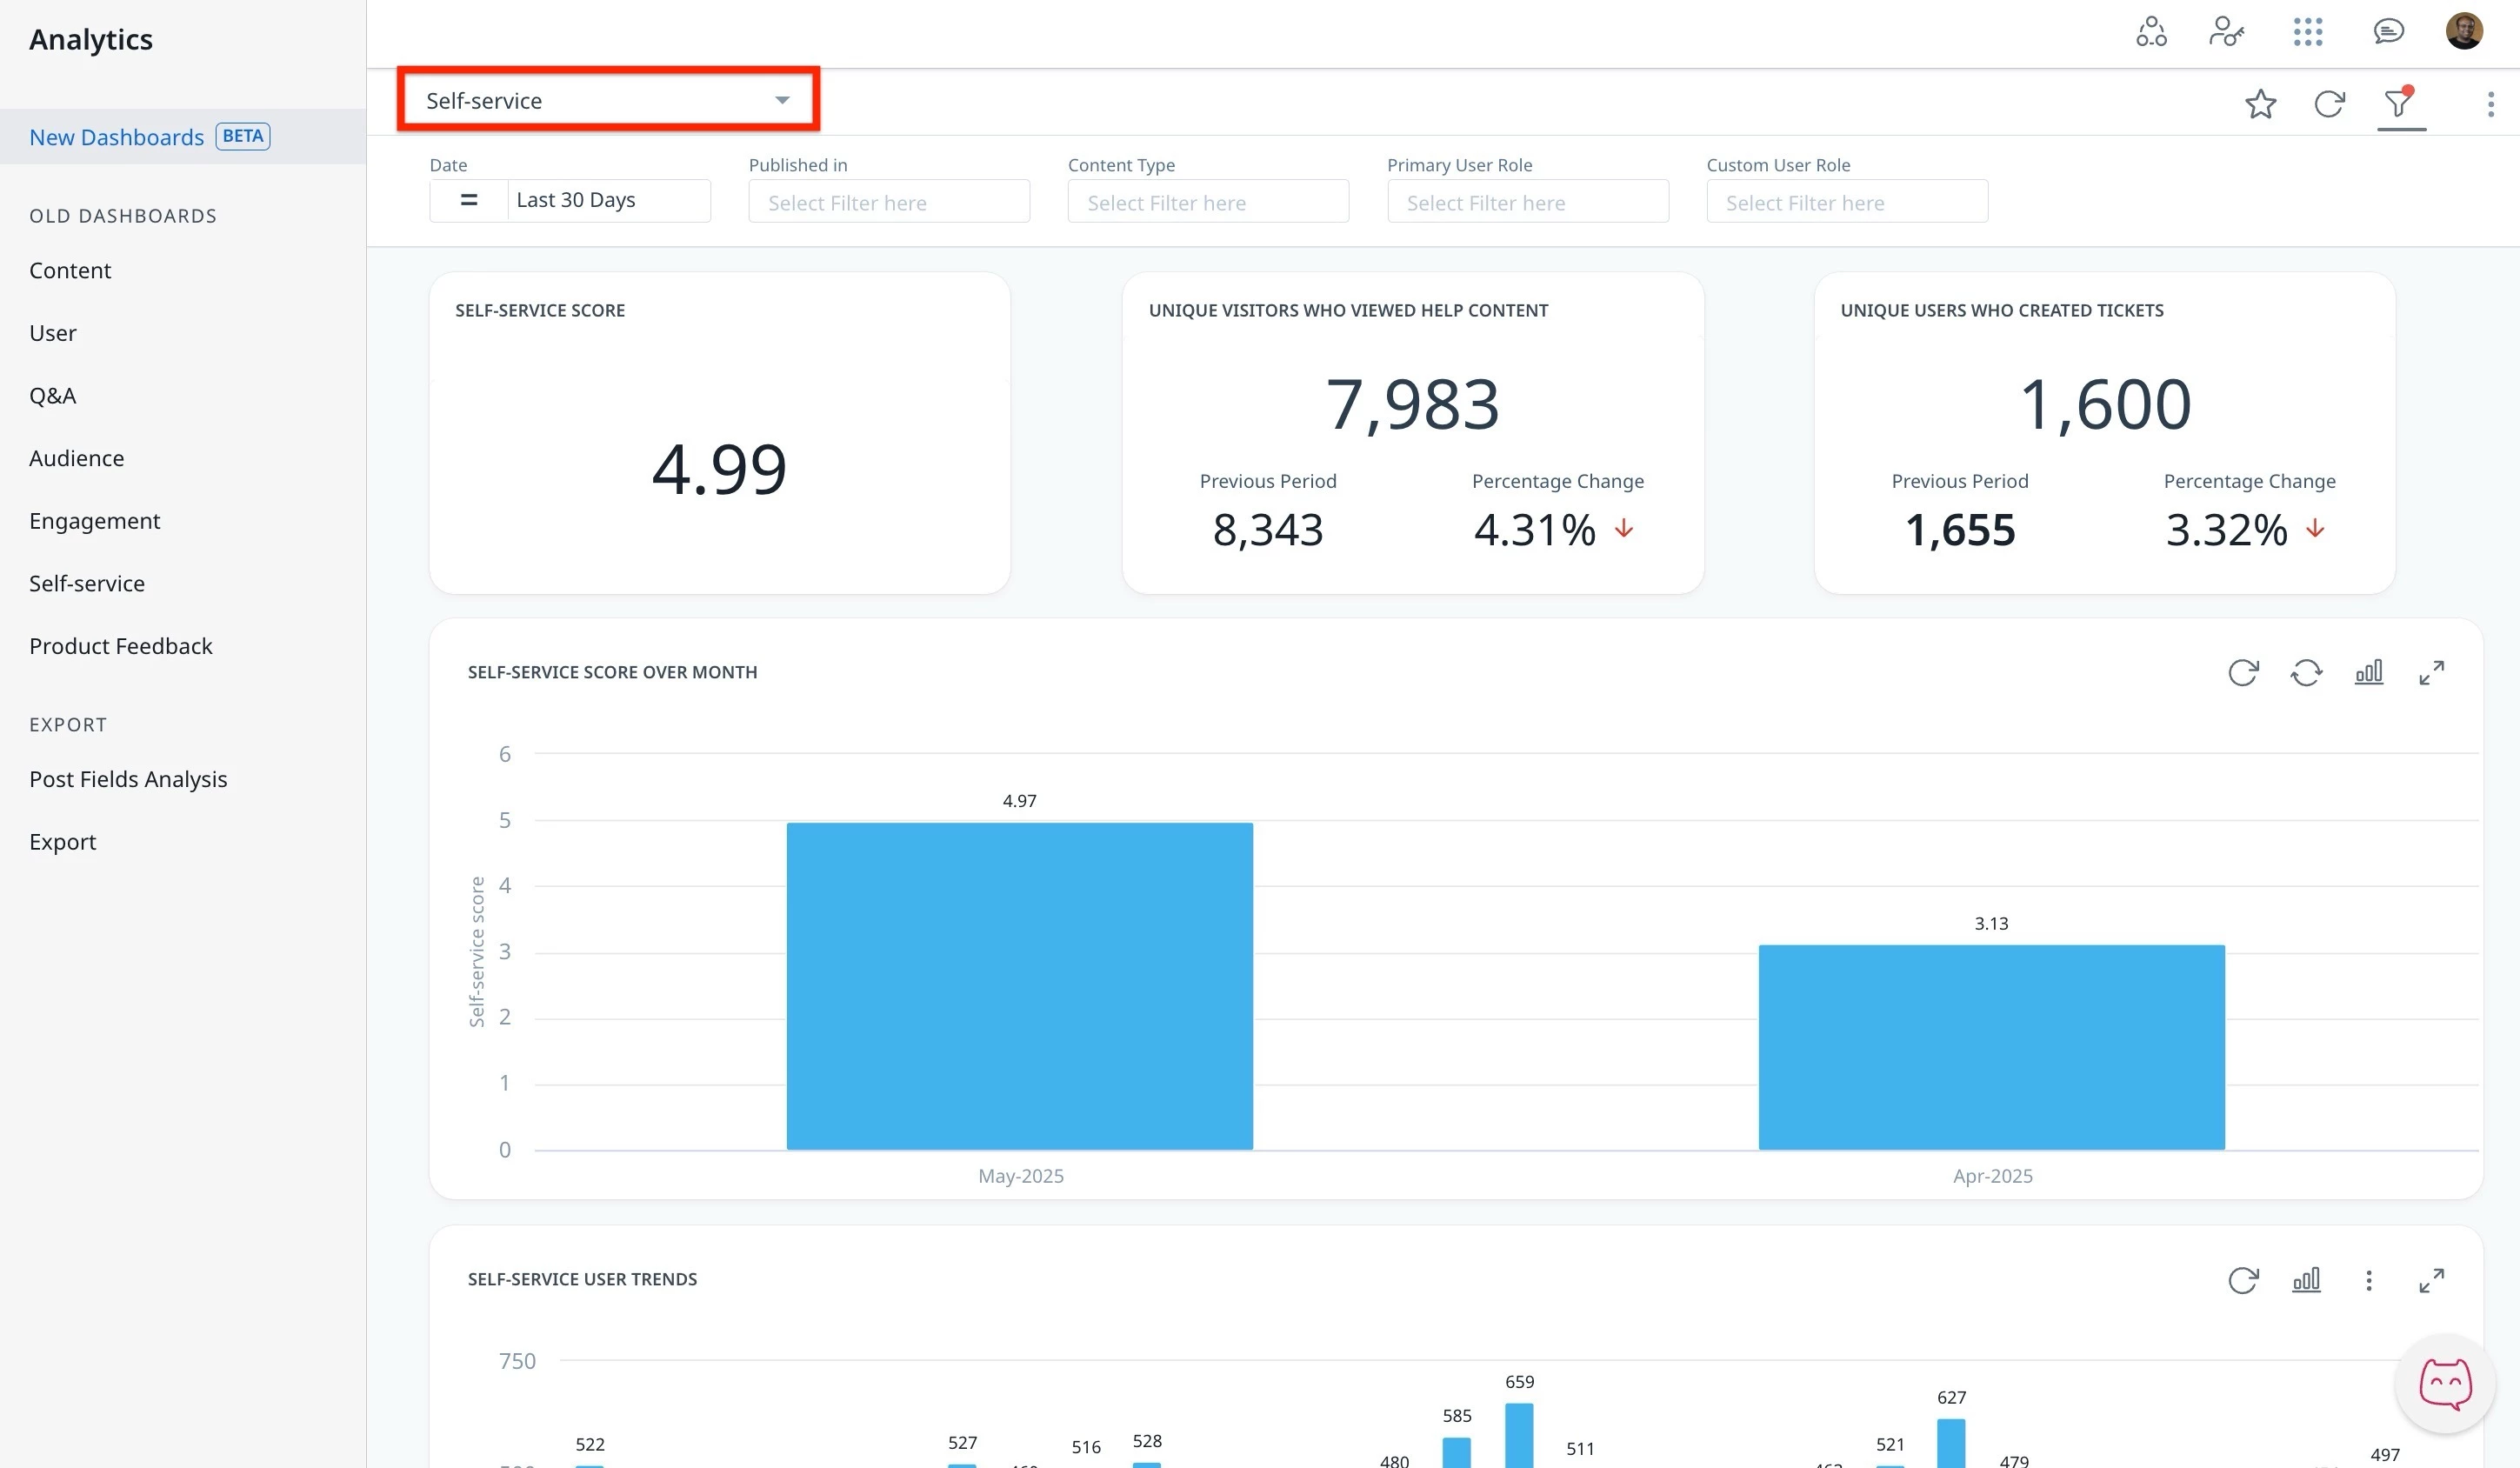
Access and Manage the Self-Service Dashboard
The Self-Service dashboard is an out-of-the-box (OOB) dashboard that can be viewed from the Analytics page.
To view the dashboard:
- Log in to Control.
- Navigate to Analytics > New Dashboards.
- From the dropdown list, select Self-Service Dashboard. The Self-Service dashboard appears.
Community managers can interact and customize the dashboard using features such as global and individual filters, report visualization options, and more.
Note: The dashboard data is displayed in UTC.
For more information on how to customize Dashboards, Widgets, and Reports, refer to the Customize New Dashboards article.
Understand the Key Performance Indicators
To make the most of the Self-Service dashboard, it’s important to understand the key performance indicators (KPIs) available in the dashboard. These KPIs track how customers engage with help content and support channels, offering a data-driven view into how well your content deflects tickets and promotes user self-sufficiency. By interpreting these metrics, you can identify gaps in content, measure improvements over time, and optimize your support strategy.
% Period to Period Change and Previous Period
Users are equipped to understand performance shifts through the % Period to Period Change and Previous Period metric, which provides a clear comparison over matching timeframes.
% Period to Period Change
This metric shows how a Key Performance Indicator has increased or decreased over time. It compares two time periods of the same length to give a fair and clear view of performance changes. For example, if you select the last 15 days, it compares them to the 15 days right before that.
Previous Period
The previous period is always the same number of days as the time period you choose. If you select April (30 days), the system looks at the 30 days just before April, not the full month of March. This helps make sure the comparison is even and accurate.
KPI Descriptions
The following table describes each KPI, along with any specific exclusions or filters apart from those mentioned above.
| KPIs | Descriptions | Filter Exceptions and Note |
|---|---|---|
| Self-Service Score | Overall ratio of unique visitors who viewed help content to unique Zendesk users who created tickets. | |
| Unique visitors who viewed help content | The number of unique visitors who viewed an article, question with a best answer, or a conversation on the community in the selected timeframe. | This metric includes only views of publicly available content, such as articles, answered questions, or conversations. For questions specifically, it only counts views that happen after an answer has been posted. Any views that occur before the question is answered are not included. |
| Unique users who created tickets | Number of distinct Zendesk users who submitted support tickets in a selected timeframe. | Zendesk users are not mapped to community users. Filter Exceptions:
|
| Self-Service Score Over Month | Ratio of unique visitors who viewed help content to unique Zendesk users who created tickets shown over a month. | |
| Self-Service User Trends | Daily breakdown of help content views over time. | |
| Helpdesk user trends | Daily breakdown of ticket submissions over time. | Filter Exceptions:
|
Note: If you want to calculate these KPIs using data from the CC Data Lake, refer to the Self-Service Dashboard KPIs – Query Reference for CC Data Lake article.