

Aleksandra
Gainsight Product Manager
November 30, 2022

The New Q&A Dashboard
Related products:CC Analytics & Reporting
  • November 30, 2022
  • 23 replies
  • 410 views
The New Q&A Dashboard


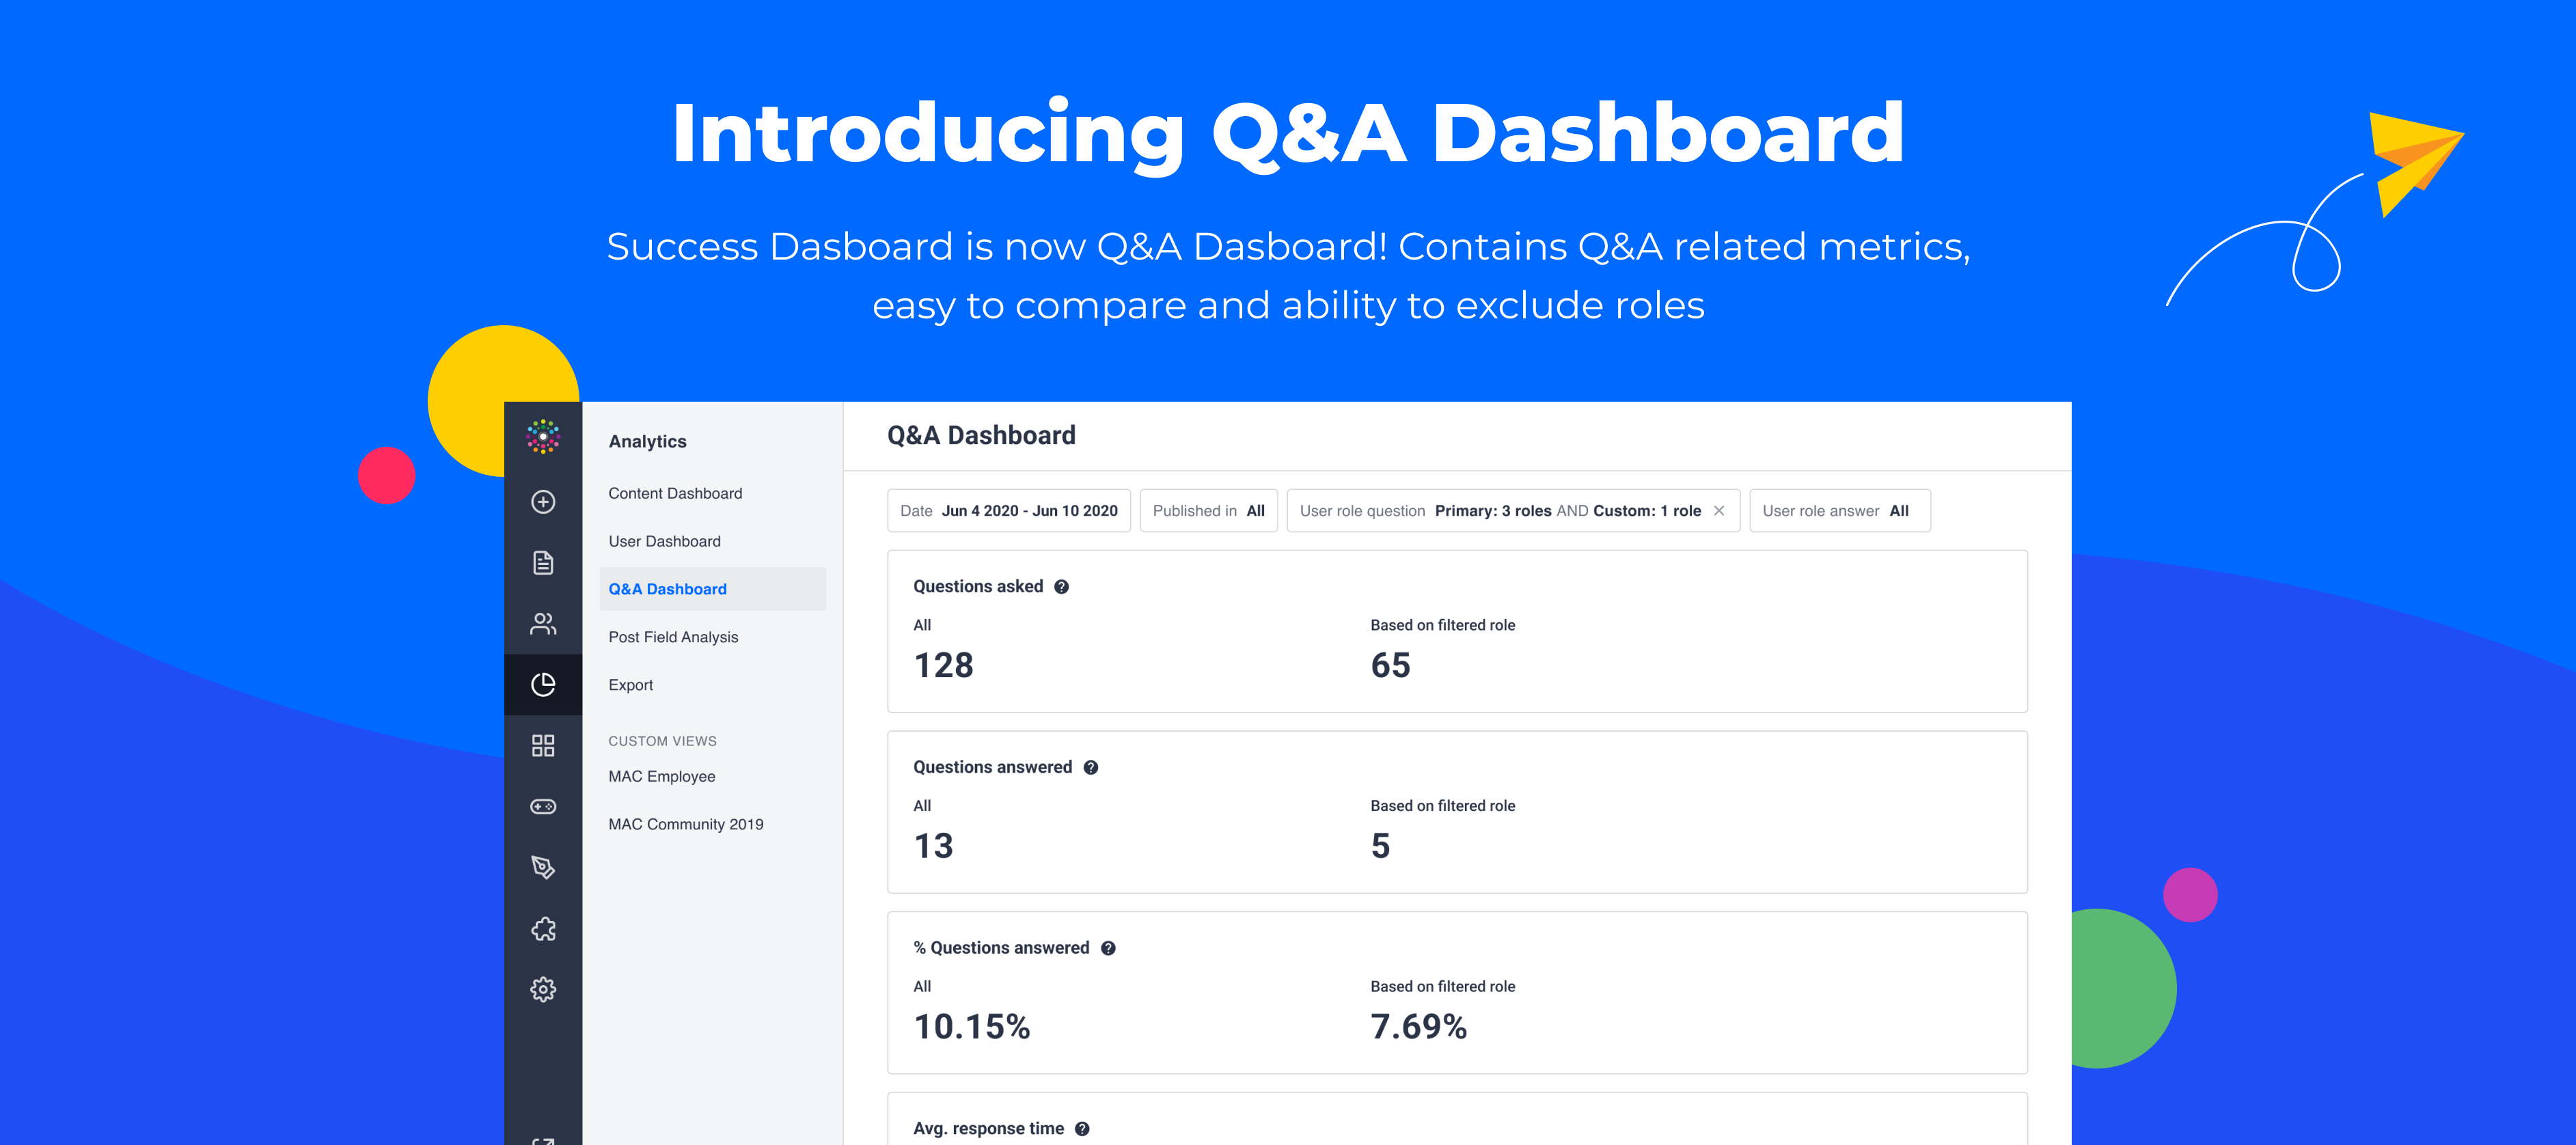
We continue to make significant analytic improvements across the platform using valuable feedback and insights from you. Based on a filtering Idea submitted, we’ve re-vamped our Community/Q&A module analytics and are excited to launch the new Q&A Dashboard, formally known as the Success Dashboard. 


The Q&A Dashboard now focuses solely on the Community/Q&A module. This ensures that the most relevant Q&A metrics are surfaced in the same dashboard providing a clear picture of community/Q&A engagement. With this dashboard, you can see the number of questions asked and answered and high-level metrics including average response time. Leverage filtering capabilities to hone in on specific datasets based on user role.


Let’s dive into the functionality by using the use case provided in the original Idea.


Filtering Community Engagement by User Roles


As a community manager, you may be interested in learning which users are most effective in answering questions in your community or what percentage of answers given came from your customers. Previously, these answers were a little hidden. With the new filtering capabilities on the Q&A Dashboard, you can now easily filter the data by user roles.


There are 4 metrics included on the dashboard:

  1. Number of Questions Asked

  2. Number of Questions Answered

  3. Percentage of Questions Answered

  4. Average Response Time


 The following filters are available to narrow down the dataset:

  • Date

  • Published In

  • User Role Question (Primary role & Custom role)

  • User Role Answer (Primary role & Custom role)


For more information on how each of these metrics and filters works, please check out this Knowledge Base article.


Using our example from above, if you are trying to understand what percentage of answers given on your community came from users with particular custom role, you’ll want to use the User Role Answer filter and select the appropriate role. This allows you to remove employees and partners to show a true participation metric.


More options to exclude some roles using filters are coming soon. 


We’d love to hear your thoughts on these improvements and how you are using these new filters!

23 replies

DannyPancratz
VIP ⭐️⭐️⭐️⭐️⭐️
November 30, 2022

I’m very excited for this feature! It will make my reporting much easier!

FYI: I am no longer active in this community
Suvi Lehtovaara
Helper ⭐️⭐️
December 1, 2022

Can I find the peer-to-peer answer rate somewhere?

https://yhteiso.elisa.fi/
Aleksandra
Gainsight Product Manager
December 1, 2022

@Suvi Lehtovaara 

Using the new User role answer filter you can now see how many answers were given by users with selected roles. If you have for example custom role non-employee, you can see all answers given by users with non-employee role.

Aleksandra
Daniele Cmty
Helper ⭐️⭐️
December 1, 2022

Hi there!
I feel like there is a mismatch between the stats on the user dashboard and the Q&A Dashboard (in this example our .com community)

For example:

User Dashboard > 1 Aug - 31 Aug 2022

3 users with the role “Customer” have at least 1 answer


Q&A Dashboard for the same timeframe gives us “2 Answers” for the same role. so 1 less.


Any idea what it could be?

Aleksandra
Gainsight Product Manager
December 1, 2022

Thank you @Daniele Cmty for the heads up. We will check it and I will come back.

Aleksandra
Aleksandra
Gainsight Product Manager
December 1, 2022

@Daniele Cmty one question, in the first screenshot, did you filter questions by Who asked? or are you checking all answers given to any questions that were asked by anyone? In the Q&A Dashboard, you applied two filters: first you filtered questions asked by users with role Customer and then you applied a filter on the answers given by users with Customer role. So you got the number of Questions asked by users with Customer roles and also answered by users with the same role. Am I right? If yes this could be the reason you see different numbers. 

Aleksandra
Aleksandra
Gainsight Product Manager
December 1, 2022

@Daniele Cmty second thing to take into account is the fact that the date range is applied to the time when the Question was asked. So it can happen that in the User Dashboard you will see a higher total number of answers than in the Q&A Dashboard in the same period of time, as in Q&A Dashboard you will see only answers to the questions that were asked in the selected time period. 

Aleksandra
Suvi Lehtovaara
Helper ⭐️⭐️
December 2, 2022

@Suvi Lehtovaara

Using the new User role answer filter you can now see how many answers were given by users with selected roles. If you have for example custom role non-employee, you can see all answers given by users with non-employee role.

Hi @Aleksandra ,

peer-to-peer answer rate is one of our key metrics, so I tried this new dashboard in order to check how I can get the rate to my future reports. 

Unfortunately the numbers are not the same as they were in the former peer-to-peer answer rate. I tried it with both primary roles (I had superuser and registered user selected) and with our custom roles. Neither of them had the same numbers.

I shared the numbers with @Nadia Nicolai , so she can give them to you 🙂

https://yhteiso.elisa.fi/
Aleksandra
Gainsight Product Manager
December 2, 2022

@Suvi Lehtovaara

Please find below the definitions of the % answered by peer KPI and % Question answered based on filtered role KPI. I believe the current approach gives you more flexibility to decide who you consider as a peer using  the User role answer. 

% answered by peer ( KPI from previous Success Dashboard)

  1. Referred only to questions asked in the selected time period

  2. Considered only answers marked in the selected time period

  3. Showed the result of the formula: questions answered by users with roles: Registered Users and Super Users divided by all questions answered

 % Question answered based on filtered role (KPI new Q&A Dashboard)

  1. Refers only to questions asked in the selected time period

  2. Considers all answers whenever they were marked ( for example answers marked in march to the question asked in January will be counted toward January result)

  3. Shows the result of the formula: questions answered (based on filtered role) divided by questions asked (based on filtered role)

An additional feature to exclude some roles is coming soon.

And if you would like to calculate the percentage with the previous formula (point 3), all numbers are available to calculate it.

I hope this answer helps you to understand the differences.

Aleksandra
Contributor ⭐️
December 2, 2022

Hello! In our community the main use case is peer-to-peer support, therefore the P2P support metric is one of our key KPI's we report weekly to the management. How can I easily find the P2P %?