Question
Strange Reporting issue: Numbers are not matching up
Good Morning-
I’m working on some data validation for our dashboards and
noticed something funny.
When I complete a search in Administration/Mass Edit, I
receive 22 results (seen below):
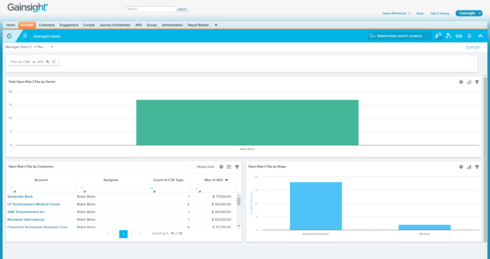
In the report I built to reflect this, I am showing 17 Risk
CTAs in the “Total Open Risk CTAs by Owner”:
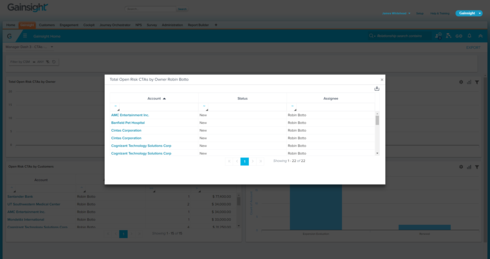
When I click on that graph, I see all 22 Open Risk CTAs:
Here is the report logic:
Am I reading this
incorrectly? With the way it’s built out
is the graph only showing the count of accounts that have risk CTAs, and then
when you click on the graph all the risk CTAs are populated?
Thanks!
-Jim
Reply
Rich Text Editor, editor1
Editor toolbars
Press ALT 0 for help
Sign up
If you ever had a profile with us, there's no need to create another one.
Don't worry if your email address has since changed, or you can't remember your login, just let us know at community@gainsight.com and we'll help you get started from where you left.
Else, please continue with the registration below.
Welcome to the Gainsight Community
Enter your E-mail address. We'll send you an e-mail with instructions to reset your password.


