
Collecting customer ideas and feedback is great, but if you do not act upon it it’s useless. Use KPIs and success metrics to help you report on the effectiveness of working on customer feedback and answering questions like: are my customers engaging with ideas, how effective are we in implementing customer ideas and how to filter ideas on priority.
This series of articles outlines guidance and best practices for Product teams who want to use inSided ideation to capture user feedback, ideas and feature suggestions from their customers to build better products.
This is the third chapter in the series and explains how you can set and measure product- and engagement goals
The series covers the following topics:
-
Chapter 3 - Measure success (you are here)
After you’ve finished reading the chapters you should view the inSided blog, another great resource on building better products.
Product Feedback Dashboard
The inSided platform comes with an out of the box dashboard on Product Feedback. This dashboard gives you a quick overview on the most important KPIs*
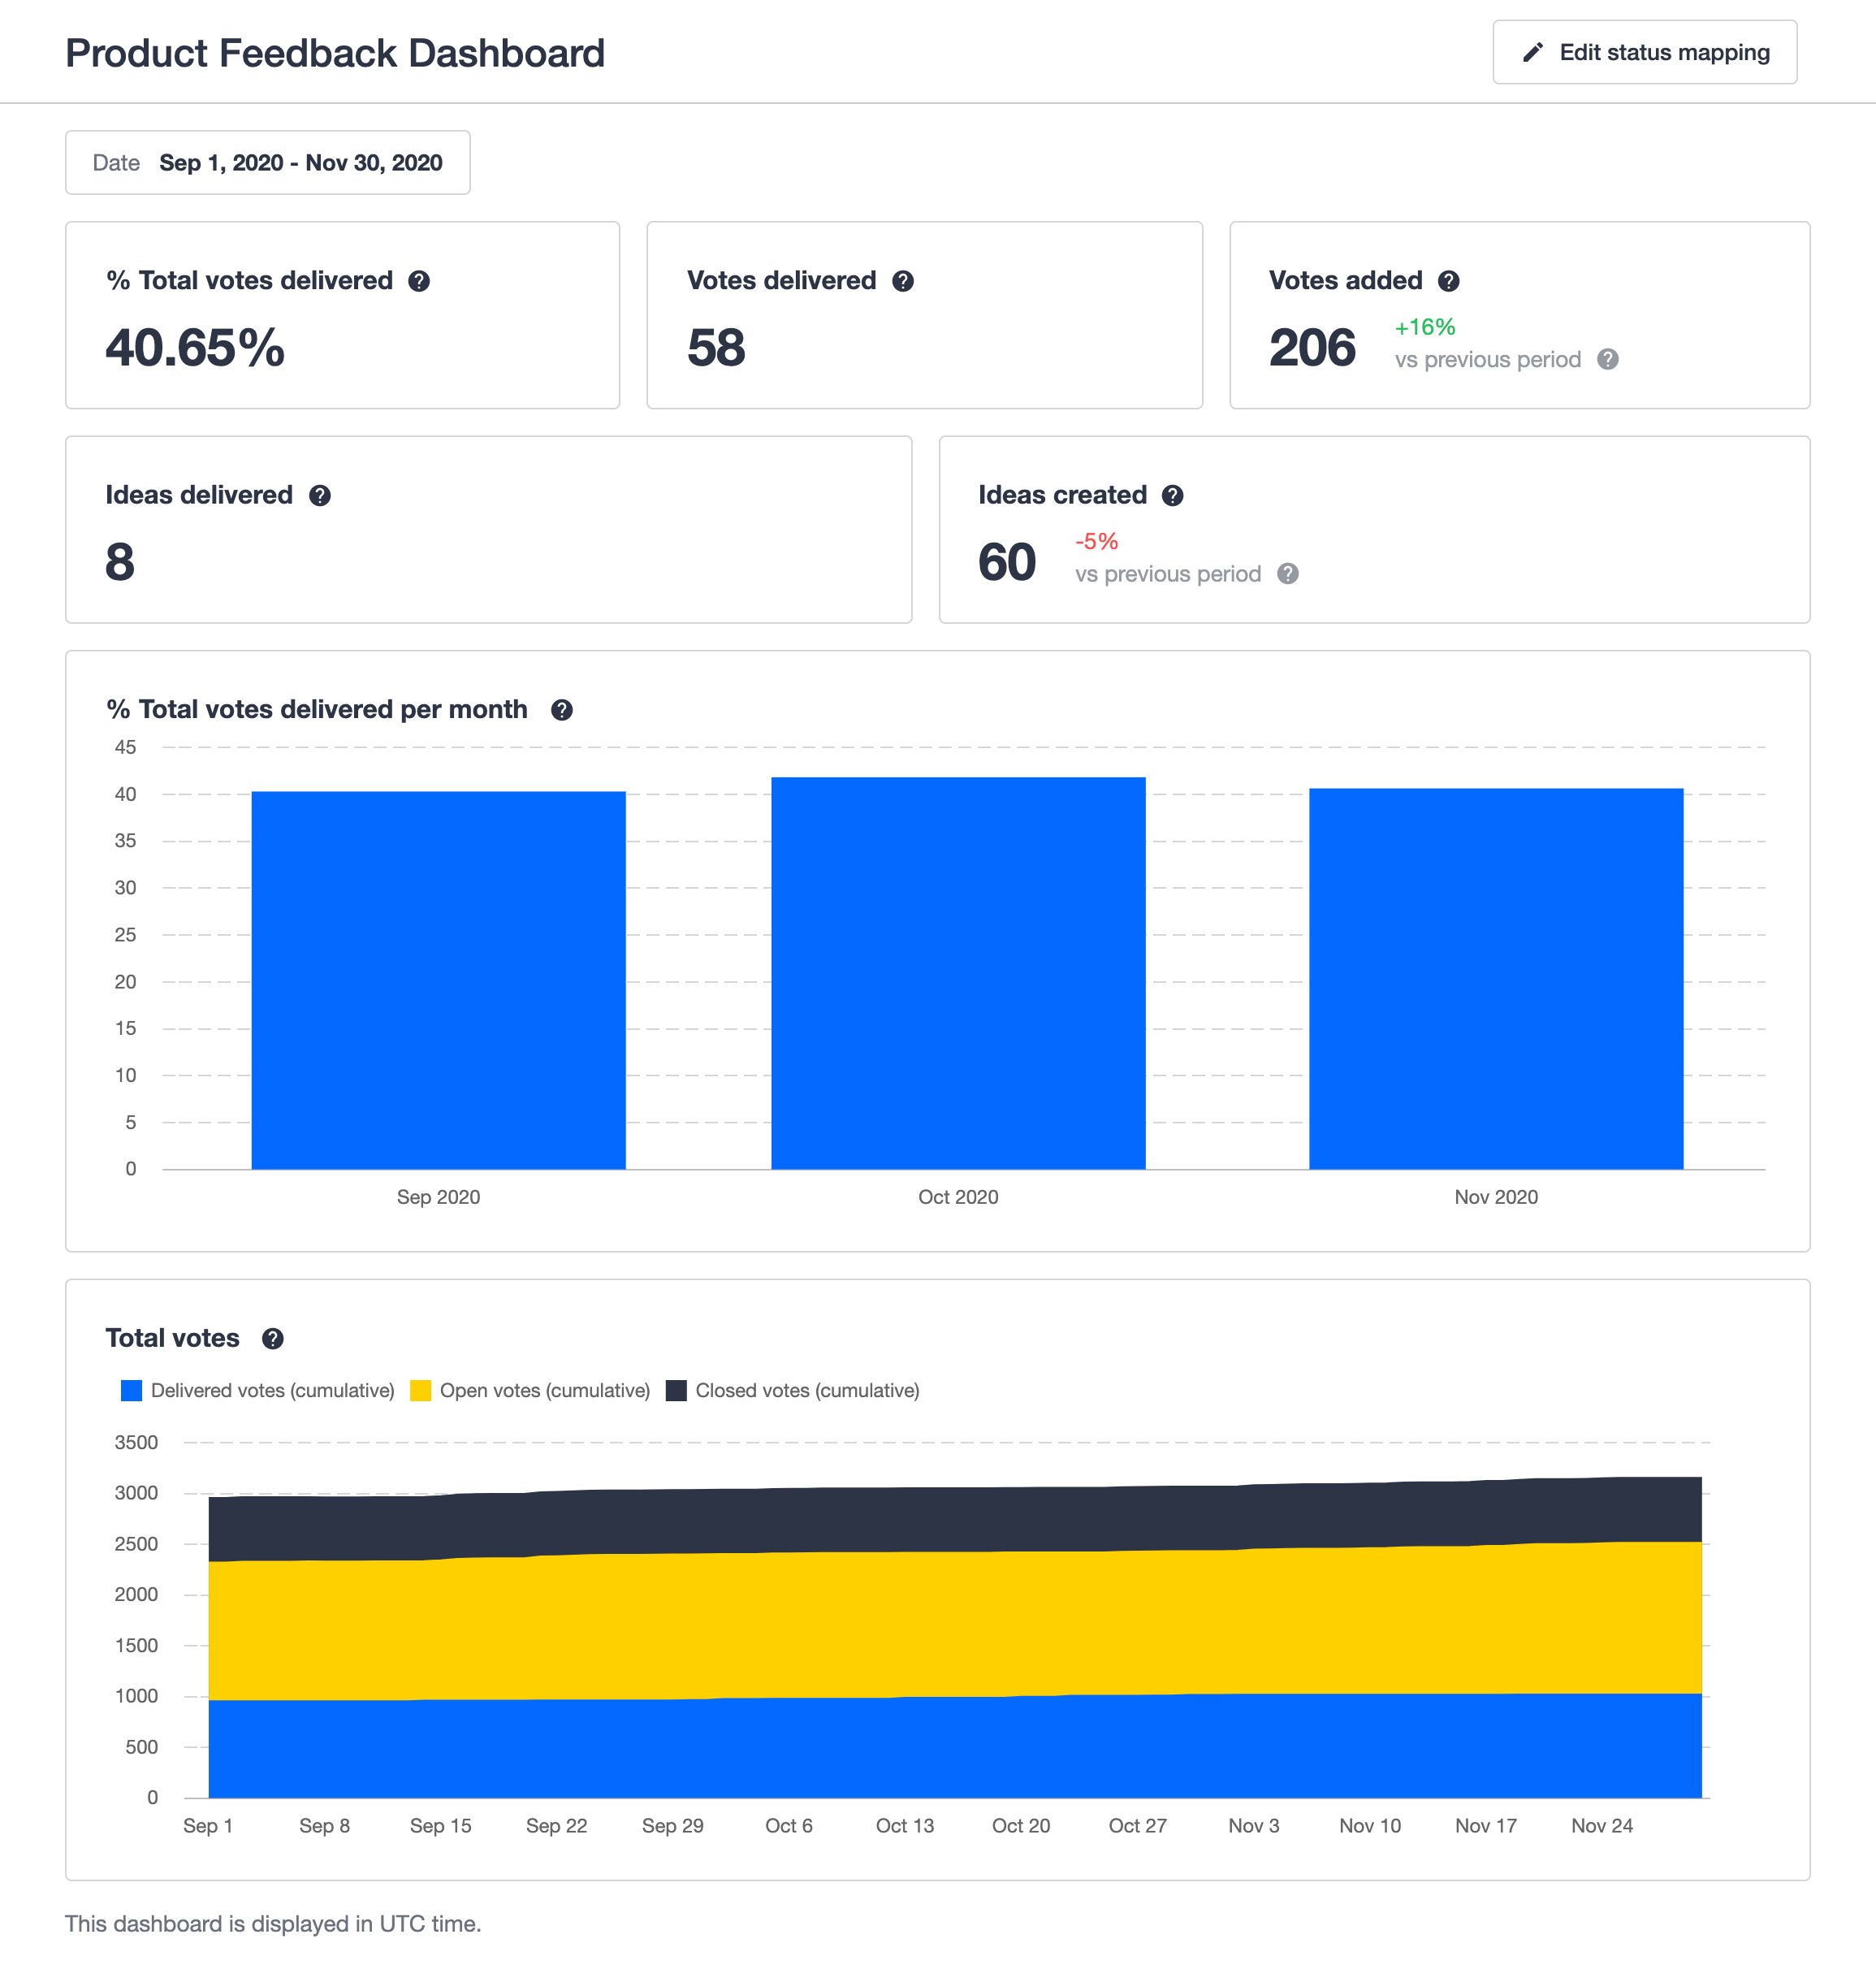
*You will need to map your idea statuses to 3 types (Open, Delivered, Closed) before you can use the product feedback dashboard.
Here’s an overview of the data you can find on the product feedback dashboard
| KPI | Description |
| % Total votes delivered | The percentage of total cumulative votes delivered up to the end of the selected time period. Excludes closed votes. |
| Votes delivered | The number of idea votes delivered in the selected time period. |
| Voted added + periodic change | The number of votes added to ideas in the selected time period. |
| Ideas delivered | The number of ideas delivered in the selected time period. |
| Ideas created + periodic change | The number of ideas created in the selected time period. |
| % Total votes delivered per month | The percentage of the cumulative total votes that have been delivered, shown on a monthly basis. Excludes closed votes. |
| Total votes | The cumulative total of open, delivered, and closed votes over time. |
How engaged are customers with ideation?
Use these KPIs: Number of votes added, Number of ideas created, % of customers active in ideation
Number of votes added is the number of new votes added to ideas in the selected time period. The periodic change will tell the percentage difference between the number of votes added to ideas in the current period versus the previous time period. A high number of votes added indicates that customers are browsing and engaging with existing ideas.
Number of ideas created is the number of ideas created in the selected time period. The periodic change will tell the percentage difference between the number of ideas created in the current period versus the previous time period. A high number of ideas created indicates that customers have a lot of product feedback, ideas, and feature requests.
How to filter and sort ideas on priority?
Use these KPIs: Absolute votes, Unique customer votes, ARR worth
Absolute votes indicates the number of unique users that votes on an idea or feature request. A high number of absolute votes can make an idea look very popular but be cautious: it may be that multiple users working for the same customer are upvoting an idea because they need it. Use this KPI to filter out ideas that have engagement and are worth investigating further.
Unique customer votes indicates how many unique customers showed their interest. This KPI can be more meaningful than the number of absolute votes as you will reach more customers. Use this KPI to filter out ideas that will benefit a larger portion of your customer base.
ARR worth indicates how much ARR is associated with an idea or feature request. A high number of ARR allows you to identify which ideas are coming from your highest value customers. Use this KPI to filter out ideas that contribute to your business growth and satisfy your high value customers.
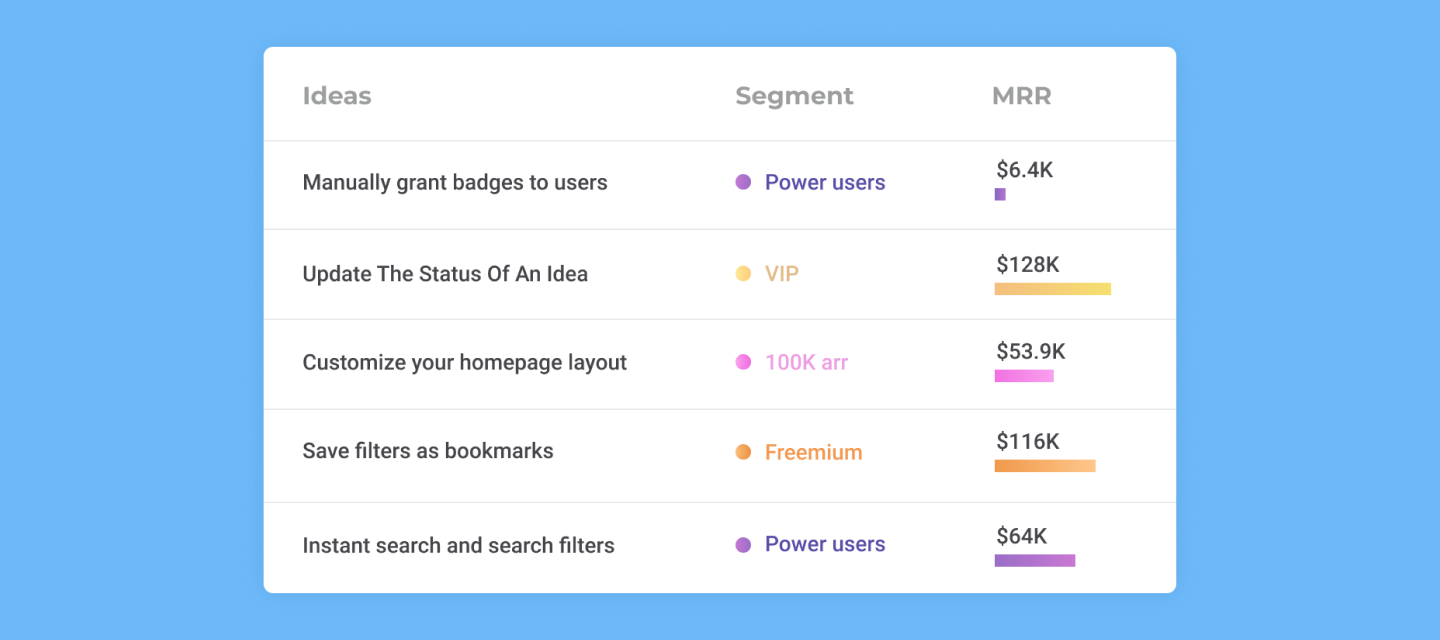
Let’s take a look at how to put these KPIs into practice:
| Idea title | Absolute votes | Unique Customer votes | ARR worth |
| Idea 2* | 40 | 12 | 118k |
| Idea 5** | 30 | 8 | 108k |
| Idea 3 | 36 | 4 | 108k |
| Idea 1*** | 62 | 23 | 18k |
| Idea 4 | 21 | 6 | 13k |
*Idea 2 has the most ARR worth and has more unique customer votes compared to the other ideas that come close to this ARR.
**Idea 5 has the same ARR but less absolute votes than Idea 3. But more unique customers are interested in Idea 5.
***Idea 1 has the most absolute- and unique customer votes, but overall the ARR worth is significantly lower than the other ideas.
How much do we listen to customer feedback?
Use these KPIs: % Total votes delivered (per month), Votes delivered
% Total votes delivered (per month) tells you how many votes you have delivered relatively to the total number of votes in a given timeframe. This KPI can be viewed on a month by month basis. A monthly steady percentage indicates that you consistently listen to- and implement customers’ feedback.
Votes delivered indicates how many absolute votes, and therefore customer voices, you have listened to. A high number of votes delivered indicates that you spent good time listening to customers’ feedback, which can result in more satisfied customers and an increased product NPS.
You can use both metrics above to set and measure periodic product objectives and key results. Here are some examples:
- By the end of the year we have delivered XX% of total votes
- Improve customer satisfaction by delivering XX ideas in Q1
- Deliver 100 total votes in Q2
In the next chapter we’ll take a look at how you can connect to other (product) tools in your tech stack.
Read Chapter 4
