
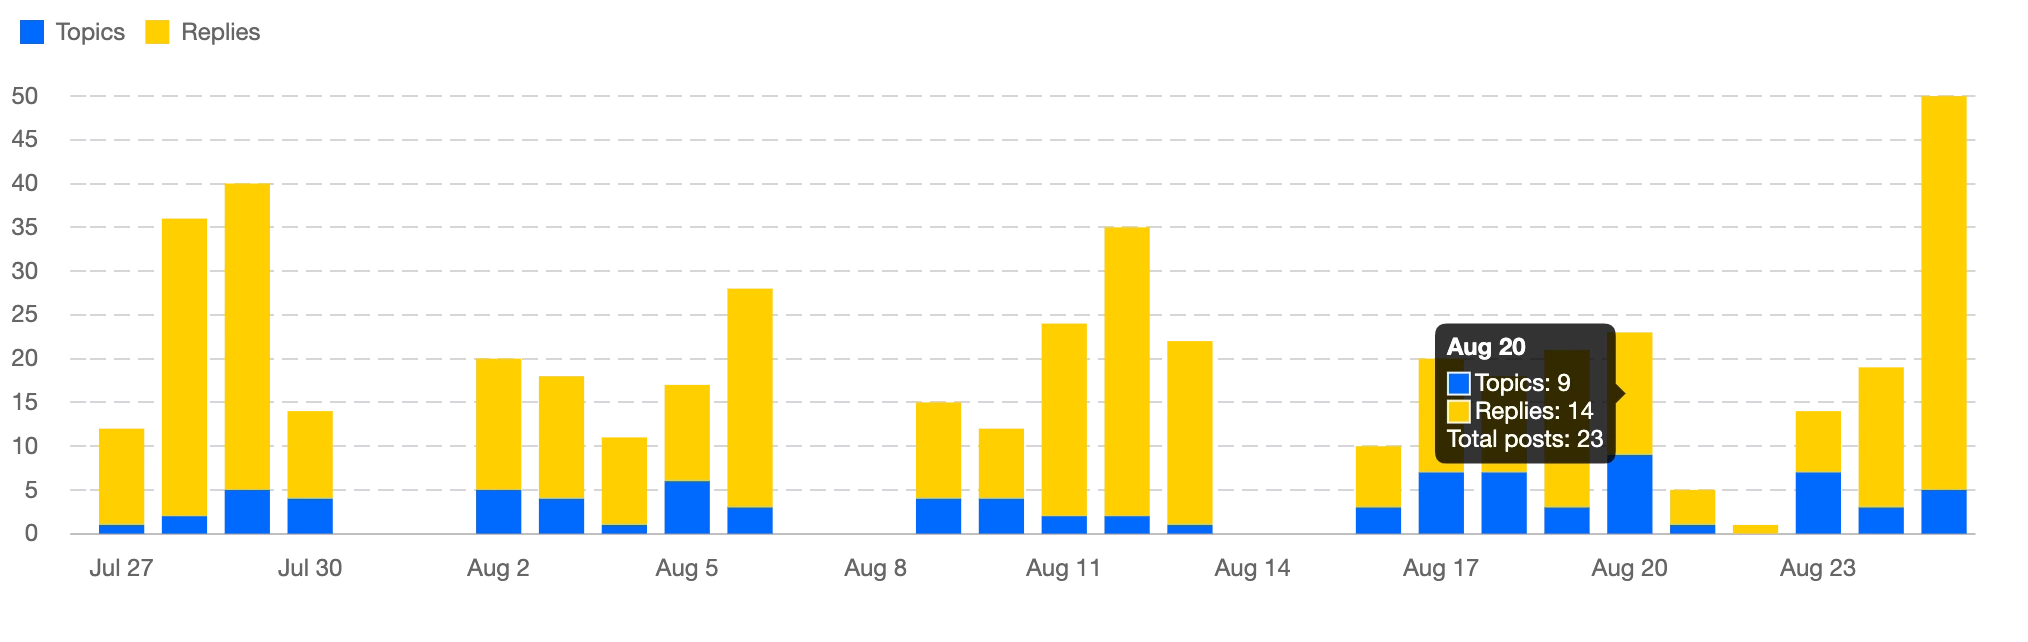
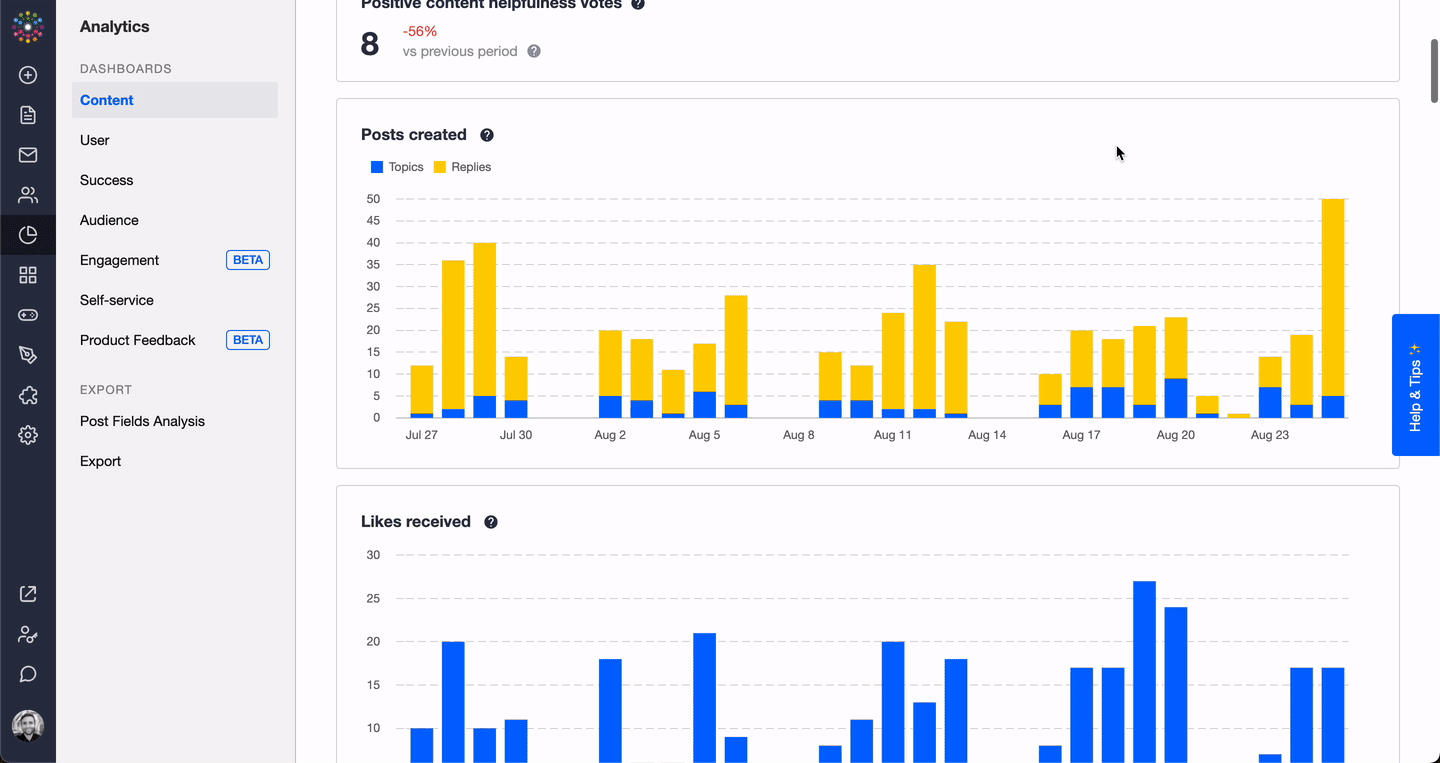
When presenting on the status of the online community to the executive team, for example, it’d be helpful to be able to pull certain graphs or numbers from the individual Analytics pages to ‘build your own dashboard’.
For example, if I want to pull New Registrations from the User Dashboard page, Page Views from the Audience Dashboard page, and Posts Created from the Content Dashboard page, there’s currently no way in the platform to put them all together in-app.
Of course, the ideal scenario would be able to build customizable components and form fully customized dashboards. This idea is maybe an MVP version of that, where you’re just pulling existing components from the various dashboards and consolidating the key metrics you want into a single dashboard.
That way, you could theoretically just take a screenshot of that dashboard and send it out. (Would be awesome to automatically subscribe to a dashboard so it’s emailed out to key team members on a regular basis, but I’ll save that idea for later). ;)
