
How to add target line when building reports?

  • January 15, 2021
  • 6 replies
  • 154 views

Aleksandra_V

Hi!

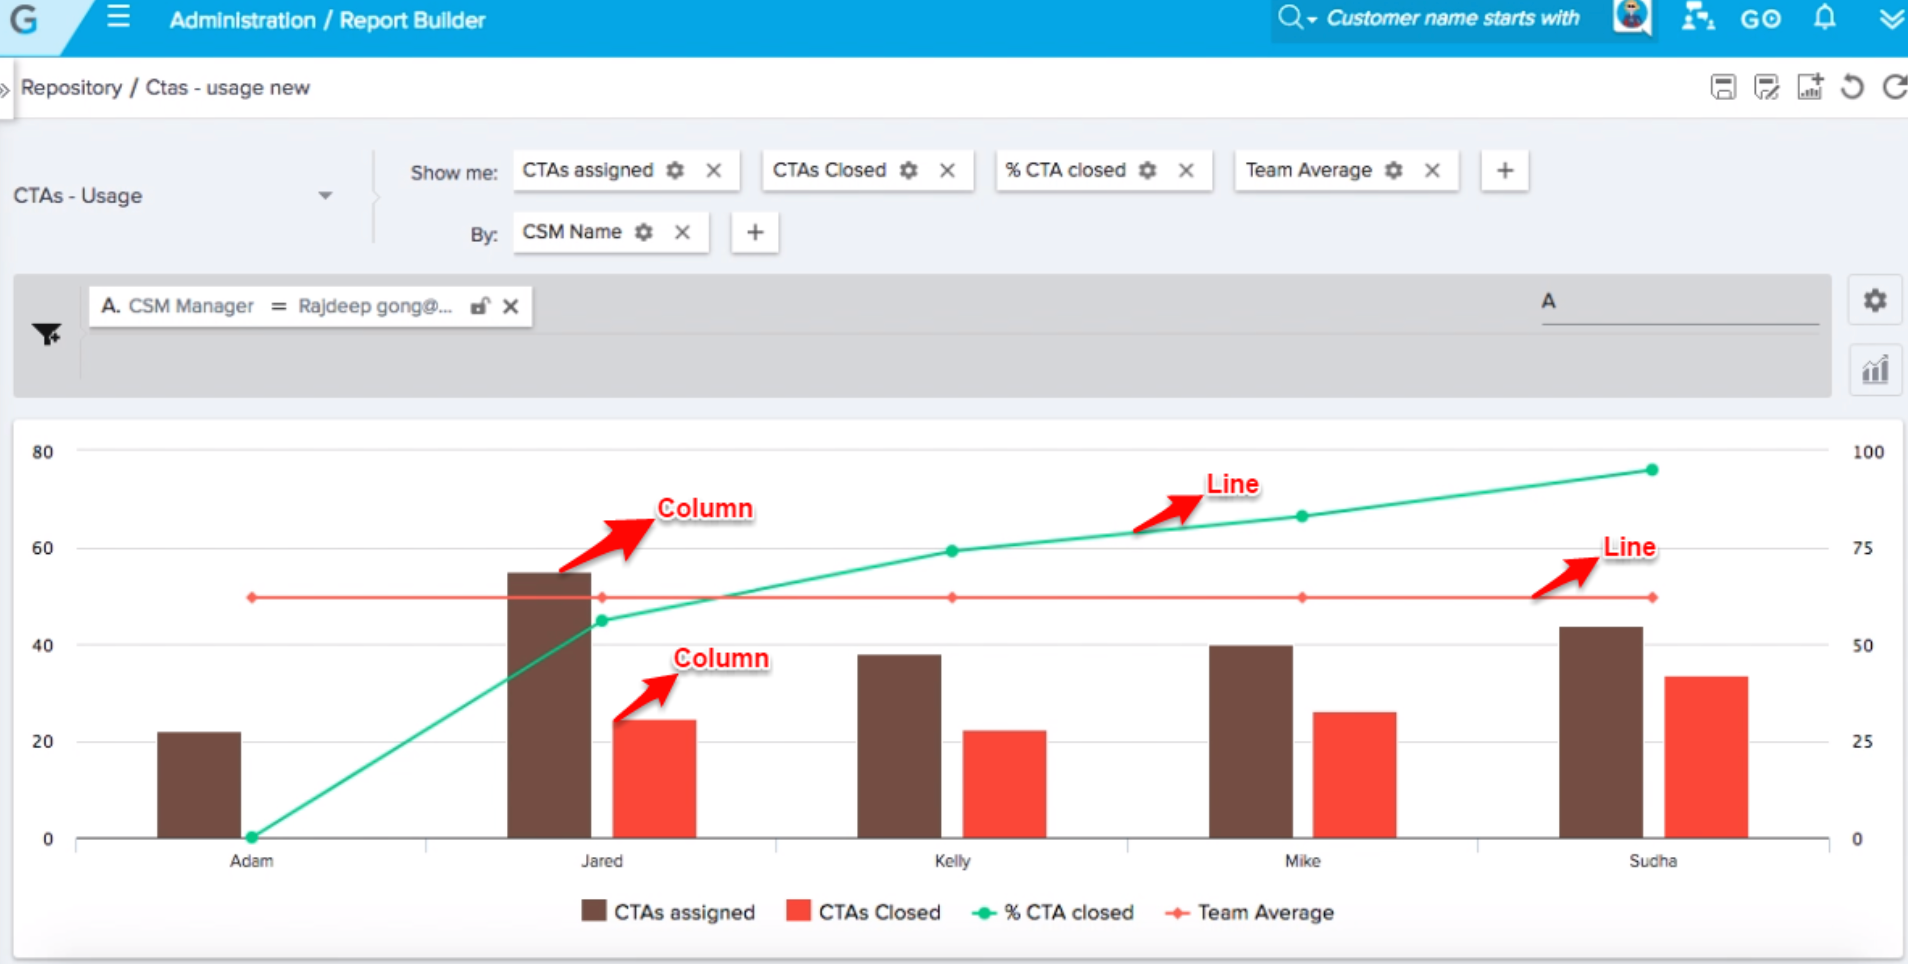
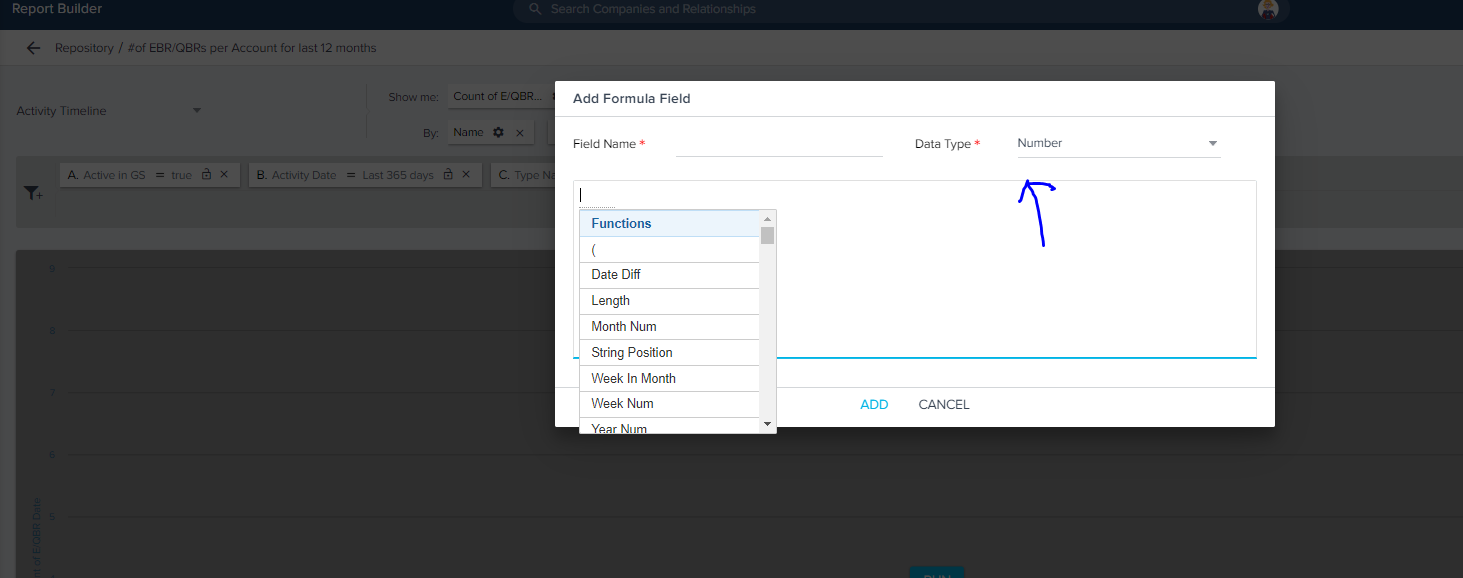
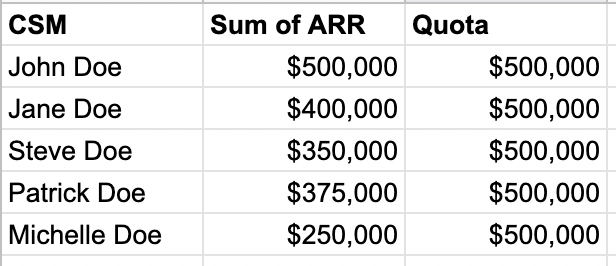
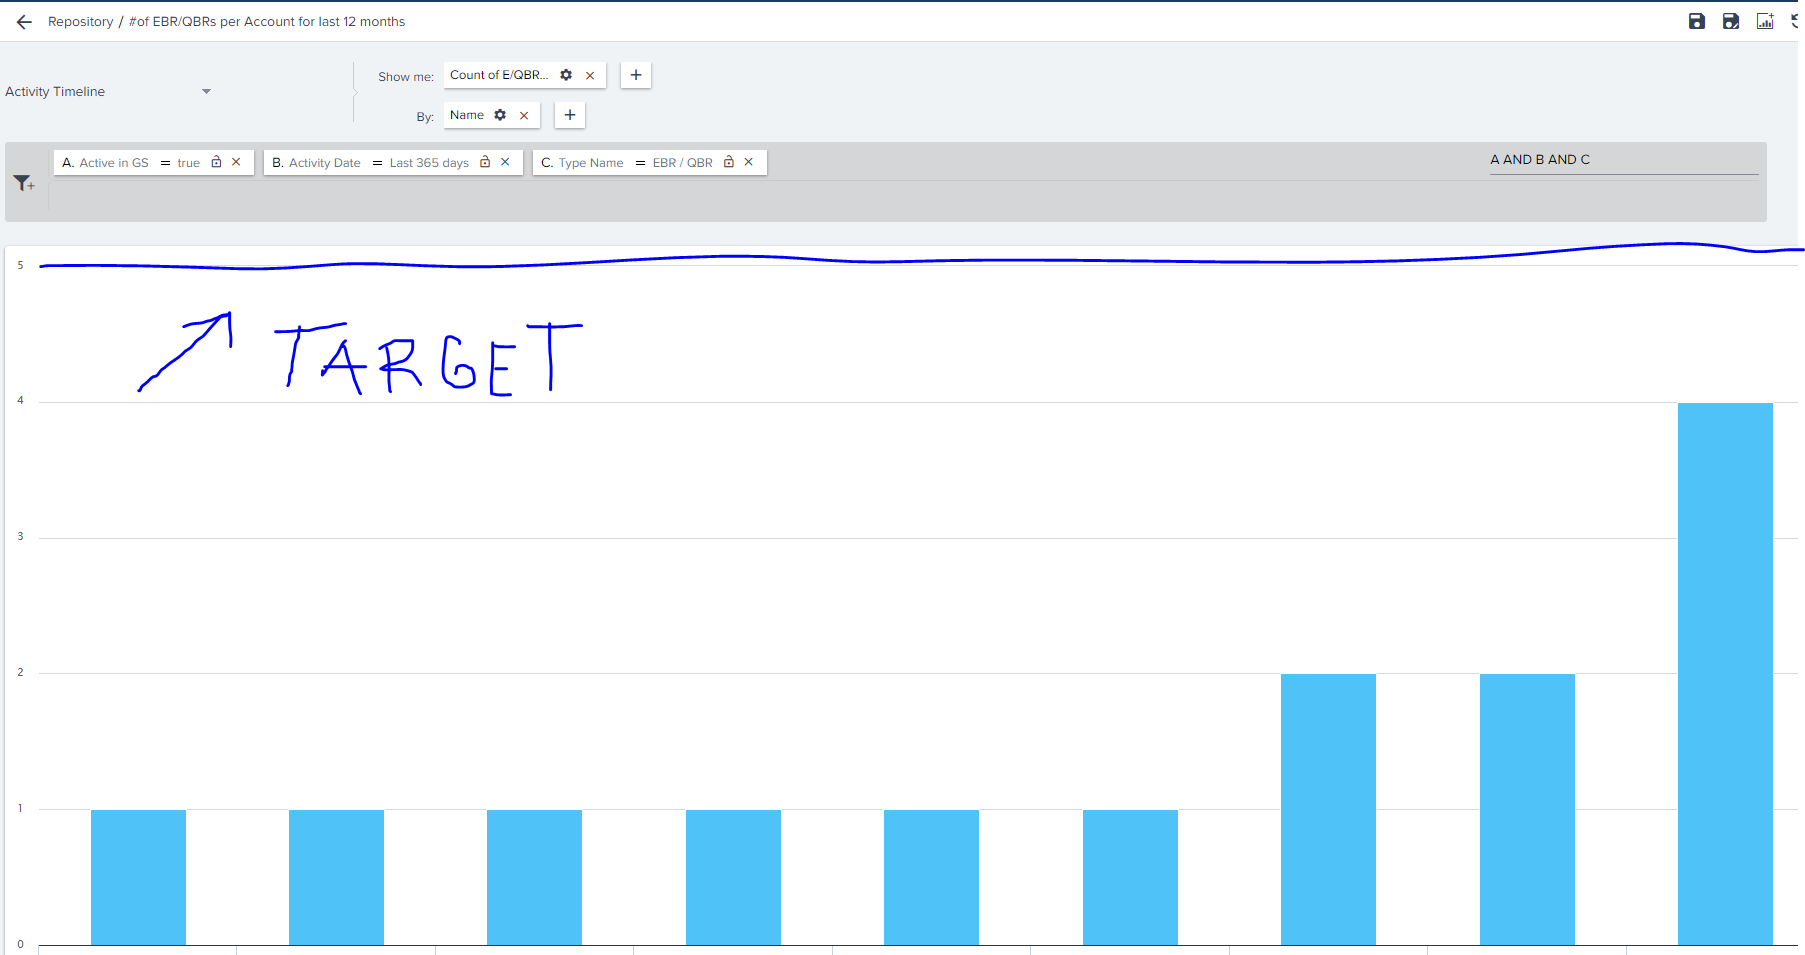
Is there a possibility to add a target line when building reports in Gainsight?

Could not find how to do it and whether this option exists.


Thanks for the help!

BR,

Alex


6 replies

spencer_engel
Forum|alt.badge.img+5
  • Expert ⭐️
  • January 19, 2021

Yes, “column line” visualization type should do the trick. I believe you’ll need another attribute in your “show” to act as that target line. 


sai_ram
Forum|alt.badge.img+1
  • Expert ⭐️⭐️
  • January 21, 2021

@Aleksandra_V did you get a chance to the view the comments posted by @spencer_engel?

sample image here


Aleksandra_V
  • Author
  • Contributor ⭐️⭐️
  • January 22, 2021

Yes, “column line” visualization type should do the trick. I believe you’ll need another attribute in your “show” to act as that target line. 

Hi Spencer, 


Thanks for your suggestion, but just to clarify, what data should I use in another “Show me” field if I want to display the overall target for this specific KPI?

I am not sure if this workaround is what I am looking for.


Is there a possibility to create a new field where I could display just a specific number, which would be displayed as a Target line?


Thanks,

Alex


Aleksandra_V
  • Author
  • Contributor ⭐️⭐️
  • January 22, 2021

@Aleksandra_V did you get a chance to the view the comments posted by @spencer_engel?

sample image here


Thanks a lot for your efforts, but I’m afraid its not what I’m looking for. I need to display a specific number which would work as a target line for all participants.


Thank you,

Alex


sai_ram
Forum|alt.badge.img+1
  • Expert ⭐️⭐️
  • January 29, 2021

@spencer_engel did you get a chance to view the comments here.


spencer_engel
Forum|alt.badge.img+5
  • Expert ⭐️
  • January 29, 2021

Yes, “column line” visualization type should do the trick. I believe you’ll need another attribute in your “show” to act as that target line. 

Hi Spencer, 


Thanks for your suggestion, but just to clarify, what data should I use in another “Show me” field if I want to display the overall target for this specific KPI?

I am not sure if this workaround is what I am looking for.


Is there a possibility to create a new field where I could display just a specific number, which would be displayed as a Target line?


Thanks,

Alex


Hi @Aleksandra_V - yes, you would need to create a field that contains your target line metric. An example would be if you wanted to display quota. 


So let’s say you have 5 contact records and you’re summing up their ARR attainment to date vs. their quota. The data would look something like this (of course you could load different quotas for different people, if necessary).


Then your Quota would be the line, and sum of ARR would be the bar chart.