

Insert zeros when usage is missing on a weekly trending report
I wasn't able to find a similar community post (apologies if this exists already). We've recently come across this issue with Cisco and a few other customers. When there is no data for a time period, that date period is removed from the report and it's connected to the next available date. We'd like the ability to display the missing dates as Zeros to provide an accurate view into the usage. This creates a more consistent experience for the end users. I've provided 2 customer scenarios below.
Cisco Use Case:
Trend view on R360 only displays months where data is processed, creating jumps in the timeline and it's not clear to CuSMs when there are months where there were not any scores for that particular month.
Customer #2 Use Case:
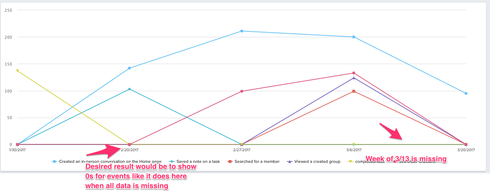
Customer2 is using our Segment connector - when there is no usage in a given week, the customer doesn't display any data (common use case). Given the volume of data they are sending us for various events, we'd want to avoid the workaround of inserting zeros for every data point that is missing for that week. Here is an example of a report where data is missing for a few weeks.
Does anyone else have use cases to share? Are there any workarounds that you've used that don't require inserting zero?
Are there any plans to address this with product?
Cisco Use Case:
Trend view on R360 only displays months where data is processed, creating jumps in the timeline and it's not clear to CuSMs when there are months where there were not any scores for that particular month.

Customer #2 Use Case:
Customer2 is using our Segment connector - when there is no usage in a given week, the customer doesn't display any data (common use case). Given the volume of data they are sending us for various events, we'd want to avoid the workaround of inserting zeros for every data point that is missing for that week. Here is an example of a report where data is missing for a few weeks.
Does anyone else have use cases to share? Are there any workarounds that you've used that don't require inserting zero?
Are there any plans to address this with product?