

Spiderweb charts for product adoption
In the pre-PX era, we have experimented with usage data from Mixpanel in Google sheets. The following graph proved very useful, both for CSMs to start a discussion with project leads at customers and for our product team to assess the adoption of features (both on global level as for strategic accounts).
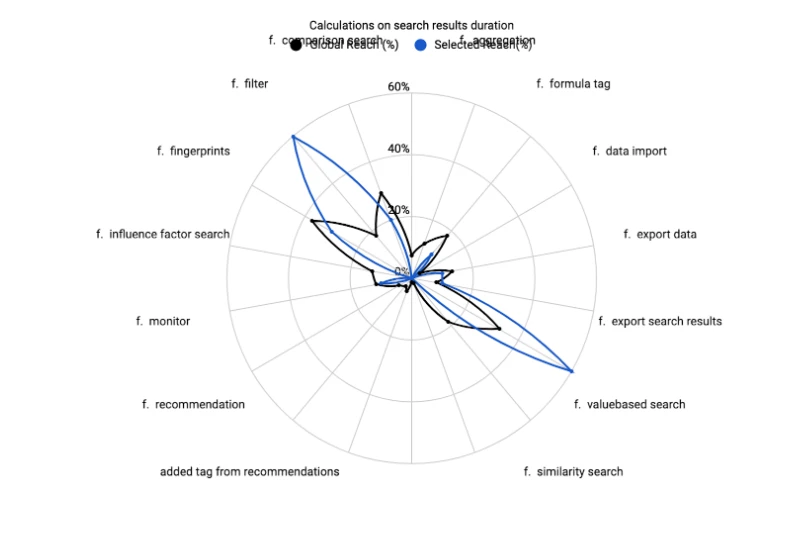
For a selected set of features, this spiderweb graph shows the percentage of users using those features for selected accounts (blue) and for all accounts (or all accounts adhering to a specific filter), so you can benchmark the feature adoption.
The graph really gives a nice overview of feature adoption and it would be great if this graphical representation would become available for PX adoption reports.