

steve_davis
Gainsight Employee ⭐️⭐️
June 28, 2016

Turning On Data Points For Line Graphs

  • June 28, 2016
  • 5 replies
  • 56 views
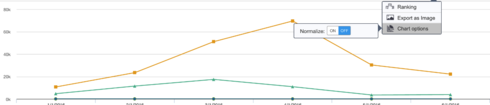
I have a customer that would like to have the option to turn data points on for line graphs. 
    5 replies

    sudarshan_vig
    Contributor ⭐️⭐️⭐️⭐️⭐️
    August 8, 2016
    Hey Steve, Just for my understanding, you might want an option to show a seamless line without data points vs. a line where the points are shown? Do I understand you correctly?

    Thanks.
    steve_davis
    Gainsight Employee ⭐️⭐️
    August 8, 2016
    Yea, the customer would just like to have the ability to be able to toggle on/off data poinys for line graphs. I they would just want a little number value next to the dot showing the value at that point in time. Make sense? 
    sudarshan_vig
    Contributor ⭐️⭐️⭐️⭐️⭐️
    August 9, 2016
    Sure Steve. from what I understand the customer required the value of the field to be shown rather than just on hover. I will add it to my roadmap and update you once its picked up. Thank!
    reneehouse
    Contributor ⭐️⭐️⭐️⭐️⭐️
    September 20, 2016
    This feature is greatly needed as we use line graphs for our utilization.  It would be wonderful to apply this feature so that we can use these for our business reviews or success plan snapshots. 
    Renee House
    sudarshan_vig
    Contributor ⭐️⭐️⭐️⭐️⭐️
    September 21, 2016
    Sure Renee, I have added the same to the roadmap. I will let you know once its picked up. Thanks !