
How can I best visualize the results from a matrix type survey question in a report to be used on a dashboard?
Below is a snapshot of a matrix question used in our survey. I’m trying to build dashboard reports for each survey question for CSMs to see overall responses from their customers.

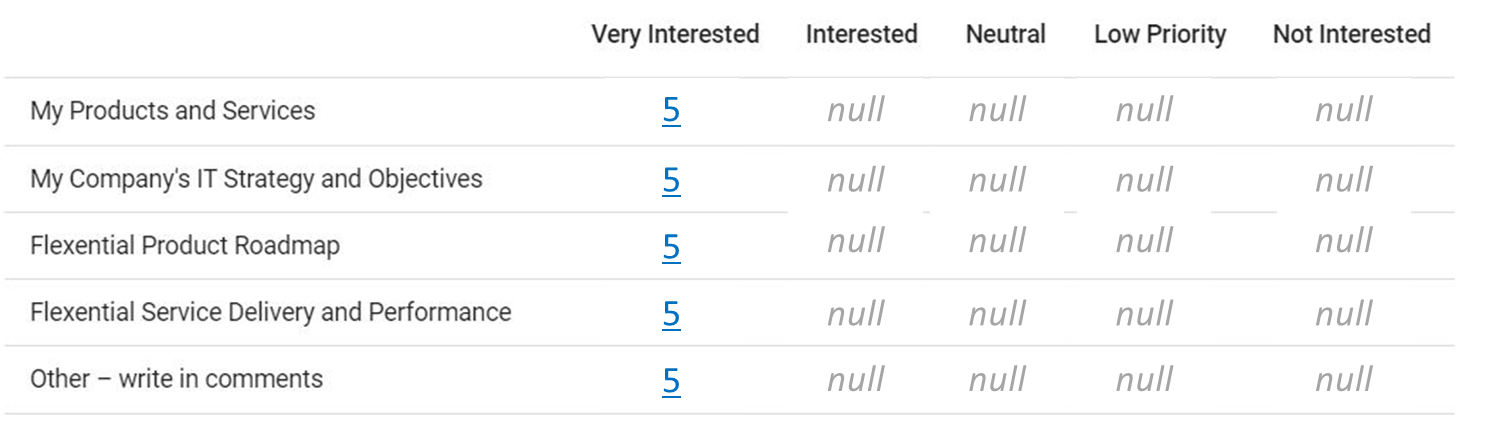
Creating a valuable view of responses to the matrix type question is proving to be challenging. Ideally, I’d like to see a report look like the snapshot below - where a total count of each response is listed for each “sub-question”. Then I want to be able to click on that number to view more detail (customer name, respondent name, response date, etc).
Is this possible or a similar view possible? Any help would be appreciated!

