

kendra_mcclanahan
Gainsight Employee ⭐️⭐️
March 24, 2017

Insert zeros when usage is missing on a weekly trending report

  • March 24, 2017
  • 14 replies
  • 51 views
I wasn't able to find a similar community post (apologies if this exists already). We've recently come across this issue with Cisco and a few other customers. When there is no data for a time period, that date period is removed from the report and it's connected to the next available date. We'd like the ability to display the missing dates as Zeros to provide an accurate view into the usage. This creates a more consistent experience for the end users. I've provided 2 customer scenarios below.

Cisco Use Case:
Trend view on R360 only displays months where data is processed, creating jumps in the timeline and it's not clear to CuSMs when there are months where there were not any scores for that particular month.


Customer #2 Use Case:
Customer2 is using our Segment connector - when there is no usage in a given week, the customer doesn't display any data (common use case). Given the volume of data they are sending us for various events, we'd want to avoid the workaround of inserting zeros for every data point that is missing for that week. Here is an example of a report where data is missing for a few weeks.
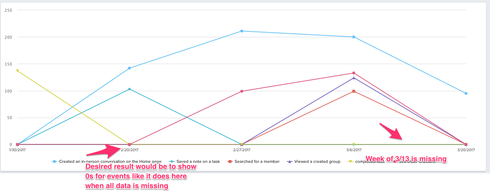


Does anyone else have use cases to share? Are there any workarounds that you've used that don't require inserting zero? 

Are there any plans to address this with product?

    14 replies

    will_robins
    Helper ⭐️
    March 24, 2017
    In GonG, we run a Rule to insert 0s every week before the Rules run that push page views to the Usage Data object
    kendra_mcclanahan
    Gainsight Employee ⭐️⭐️
    March 24, 2017
    Thanks Will! We'd like to avoid inserting zeros as a workaround and are looking for a true product enhancement for MDA reports.
    dstokowski
    Gainsight Employee ⭐️⭐️
    March 24, 2017
    Where would you see this determination being most useful - should it be part of the metadata for a measure (i.e. treat no data as zero) or reporting specific (i.e. show no data time periods)?  Either way, reporting will need to respect but wondering if there are other places a meta data approach would be valuable.
    kendra_mcclanahan
    Gainsight Employee ⭐️⭐️
    March 27, 2017
    Having this as an option in the metadata would certainly solve this use case, as well as a common problem in the rules engine with null data for MDA rules. I'd say that'd be more useful than just solving for the reporting gaps alone.
    sundar
    Expert ⭐️
    March 29, 2017
    Kendra - Can you explain this a bit further "as well as a common problem in the rules engine with null data for MDA rules" . This can be solved in bionic rules or with Absence of data in Custom rules right?
    dstokowski
    Gainsight Employee ⭐️⭐️
    March 29, 2017
    On the "treat no data as zeroes" - the basics here are that if say a specific usage metric has no activity in a week, no data is sent to Gainsight for that specific metric.  What no data would mean for some metrics and the desired approach would then be to treat as zero.  Certainly in reporting this becomes an issue as we look at some trend line - dates are missing from the view.  Not sure what Kendra is referring to related to the "null data for MDA rules" piece.
    kendra_mcclanahan
    Gainsight Employee ⭐️⭐️
    March 29, 2017
    Ah - we can do 'null data for MDA data' with Bionic rules - fantastic! Apologies I hadn't explored that prior to making the comment.

    So in this case then with the initial post, we're really looking to see trends in reports where no data exists for a given week.
    sdrostgainsightcom
    Gainsight Employee ⭐️⭐️⭐️
    March 30, 2017
    Chiming in on the "pivot by date" request - I wouldn't say the request is "treat no data as 0" - it's more a case of allowing me to pivot for 12 weeks, for instance, or 12 months, and see every month as a marker on the X axis whether or not there were rows with that date in the table.

    If the purpose of creating a graph is for fast visual consumption of a data set, and we simply drop out the weeks on the X-axis where there was no usage, we're creating a misleading visual. Unless I look closely at a 24-month graph that had no usage during 2 months, I'll probably assume that usage has been steady for 2 years.

    However we do it, we want to get away from writing 0's to fields with rules engine -- ultimately, there IS a difference between 0 and NULL -- and when looking at tables, we want to preserve that.  When graphing over time, though, we should treat it like any other incremented X-axis in graphing - retain each increment to show what happened during that month, or week, or day.
    Scott Drost, Gainsight -- Principal Customer Success Architect
    dstokowski
    Gainsight Employee ⭐️⭐️
    March 30, 2017
    Agree Scott - we want to get away from writing zeroes.
    sundar
    Expert ⭐️
    March 31, 2017
    Scott - In that scenario we need to tell the system there are 12 data points for which we need to use rules and write zero in the null scenarios directly right. Bionic rules and absence of data will give you an option to do that easily but still it has to be handled explicitly right? Is there any Drost methodology for doing this?