

darkknight
Expert ⭐️
Sep 21, 2015 4:25 PM UTC

Reports 2.0: Ability to change X or Y axis numbering to exclude decimal notation

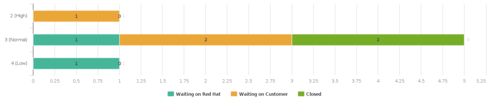
When I create a support case report and a customer's case volume is low, the X-axis shows decimal notation, but there is no such thing as 0.25 of a support case. (see image)


Need the ability to determine whether or not the decimal notation is contextually applicable and enable or disable where appropriate.
    28 replies

    sumesh
    Helper ⭐️⭐️
    Sep 24, 2015 11:00 AM UTC
    Hi Jeff,

    If we automatically detect whether decimals are required based on the available dataset, will that work?

    Thanks,
    Sumesh
    Translate
    darkknight
    Expert ⭐️
    Sep 24, 2015 12:11 PM UTC
    Yes I believe that would work.
    Translate
    Jeff Kirkpatrick
    darkknight
    Expert ⭐️
    Jan 20, 2016 2:43 PM UTC
    Any update on this?  The decimal places look very unprofessional on reports where you are reporting on items that cannot be "half" like Cases, CTAs, etc.
    Translate
    Jeff Kirkpatrick
    sumesh
    Helper ⭐️⭐️
    Jan 21, 2016 9:42 AM UTC
    Hi Jeff,

    This enhancement request will be executed in the next 1-2 months

    Thanks!
    Translate
    darkknight
    Expert ⭐️
    May 27, 2016 5:20 PM UTC
    Hi Sumesh - any update on this?
    Translate
    Jeff Kirkpatrick
    gaurav_kotak
    Expert ⭐️
    May 31, 2016 9:09 PM UTC
    Jeff, let me follow up on where this pebble is. Essentially what we'll do is, the aggregate number will have same decimals as maximum decimals on any entry in the data set being aggregated. does that work?
    Translate
    darkknight
    Expert ⭐️
    May 31, 2016 9:11 PM UTC
    Thanks Gaurav - could you provide an example so I'm clear?
    Translate
    Jeff Kirkpatrick
    connor_kasser
    Contributor ⭐️⭐️⭐️
    May 31, 2016 9:48 PM UTC
    Yeah an example would be great. In reading your answer, it appears that if the data set has numbers with 2 decimal place precision, then the graph will also have that. If the dataset is all rounded up to no decimals, the graph will also have that.

    Can you confirm if this is true of all numeric columns or just the specific column? Also what about count of IDs or Names, that do not have any decimal place precision? 
    Translate
    gaurav_kotak
    Expert ⭐️
    May 31, 2016 11:48 PM UTC
    I actually misread original issue, that it's about label of axis. 

    Ok so in general anything that plotting a count (or count distinct) will always have axis by whole number. If the aggregate is a sum, average, min, max (only available if underlying field is numeric) the axis will be 2 or decimal points of value in that field with most decimals. E.g. if I plot average of ARR across customers, and ARR field has 2 decimals axis will have 2 decimal. But if I plot average age of CTAs across customers, this will whole number since age is calculate in days, not fraction of days. Of course if it is count of support cases by (anything) will always be whole.

    For bar, column charts, line you can only plot 1 value, so the X or Y axis. For scatter charts or bubble charts you can plot a value each on X and Y axis, e.g. average of AGE maybe on Y axis and average of ARR can be on X axis. So Y axis is whole, where X axis is 2 decimals. Makes sense?
    Translate
    connor_kasser
    Contributor ⭐️⭐️⭐️
    Jun 1, 2016 10:29 PM UTC
    Hi Gaurav, I don't think your explanation with respect to CTAs is accurate. Please see the attached image

    Translate